After the cryptocurrency market experienced a low of $58,300 yesterday, it rebounded to near the highest point of $62,000 in the early morning today. Ethereum also briefly surged to $3,430. In the article "The impact of the 6.23 Ethereum spot ETF is limited, and it may fall to a new low after approval" published by Da Xian on the evening of June 23, the short position of 3,500 given has dropped to a low of 3,210. At the time of writing, the price is $3,382.
The demand for Ethereum spot ETF is expected to be much lower than that of Bitcoin spot ETF. Ethereum does not have a demand catalyst like Bitcoin's halving. The value proposition of Bitcoin investors is different from that of Ethereum. The halving of Bitcoin, as a potential bullish event, is also an additional catalyst for creating demand for Bitcoin spot ETF. Ethereum does not have a similar driving force. Due to the less active trading activity in the Ethereum market compared to Bitcoin, and the relatively small total managed assets, investors' interest in Ethereum spot ETF may not be as high as that of Bitcoin spot ETF. Therefore, the initial market response to Ethereum spot ETF may be negative, which may put downward pressure on the price of Ethereum.
Ethereum 4-hour chart
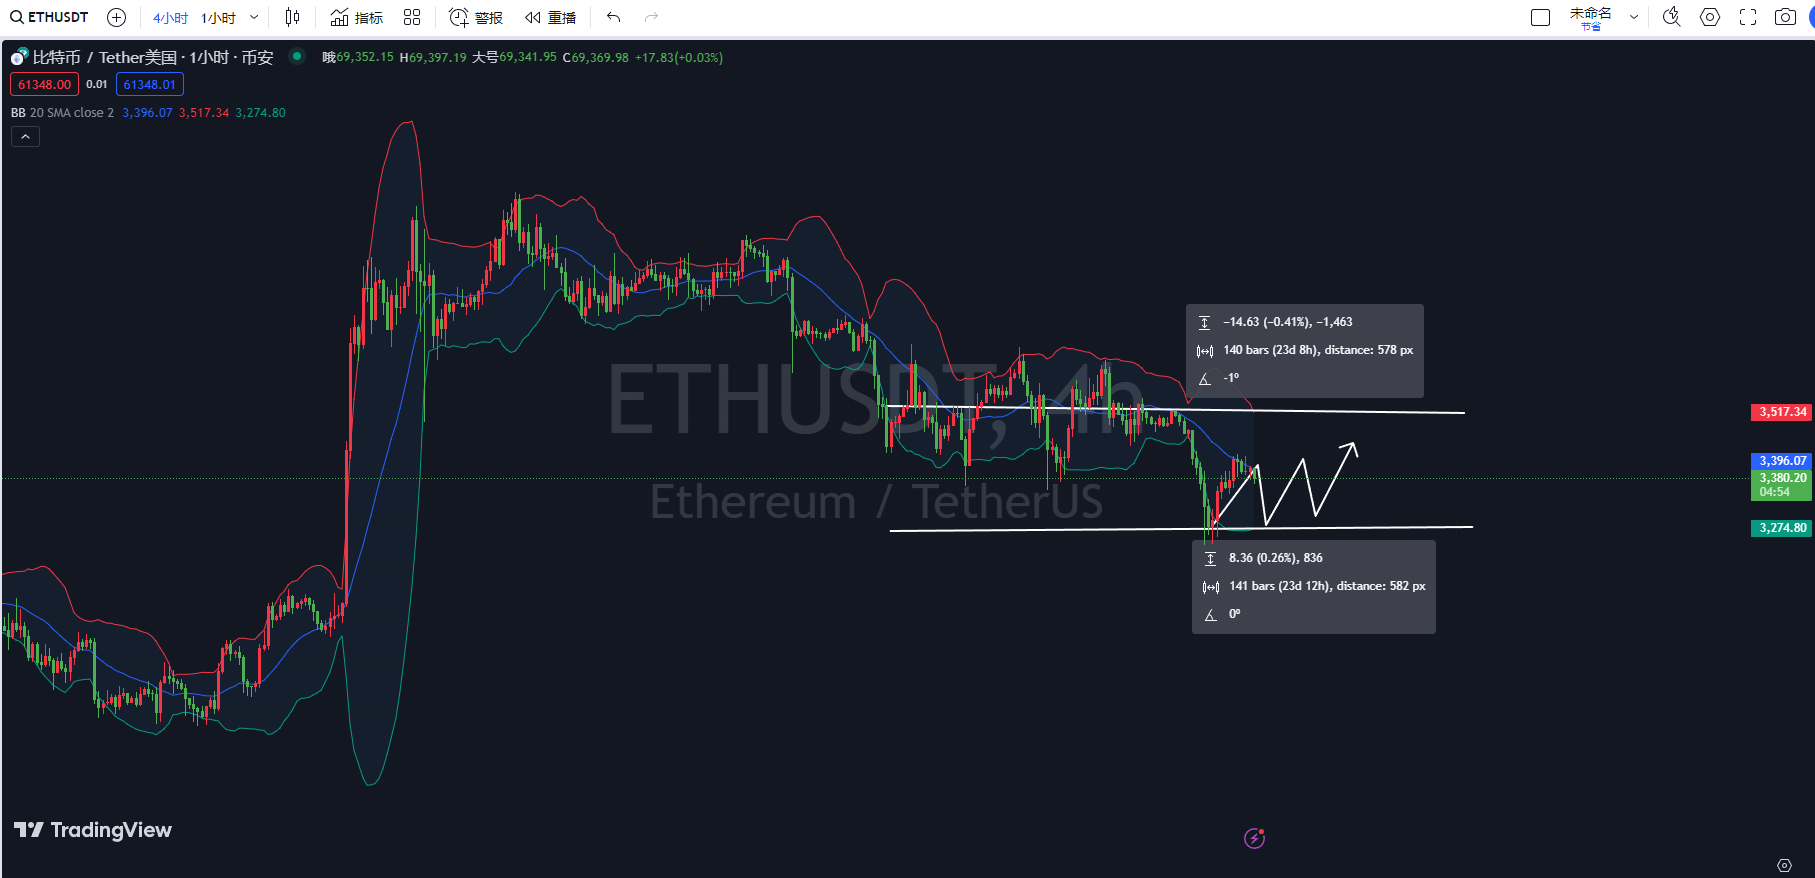
First, according to the Bollinger Bands indicator on the 4-hour chart of Ethereum, the Bollinger Bands are narrowing, indicating a decrease in market volatility. The current price is fluctuating between the middle band at 3,394 as short-term resistance and the lower band at 3,275 as short-term support.
Second, according to the KDJ indicator on the 4-hour chart of Ethereum, the KDJ three-line value is forming a bearish cross at a high level, indicating the possibility of a pullback in the short term. The K line value is rapidly moving downward, indicating an increase in downward pressure in the short term, and there may be a small rebound in the near future.
Finally, according to the MACD indicator on the 4-hour chart of Ethereum, the DIF line and the DEA line are running below the zero axis, indicating that the overall market is still in a downtrend. The red histogram of the MACD is gradually shortening, indicating a weakening of the rebound momentum, and the market is about to enter a downtrend.
Ethereum 1-hour chart
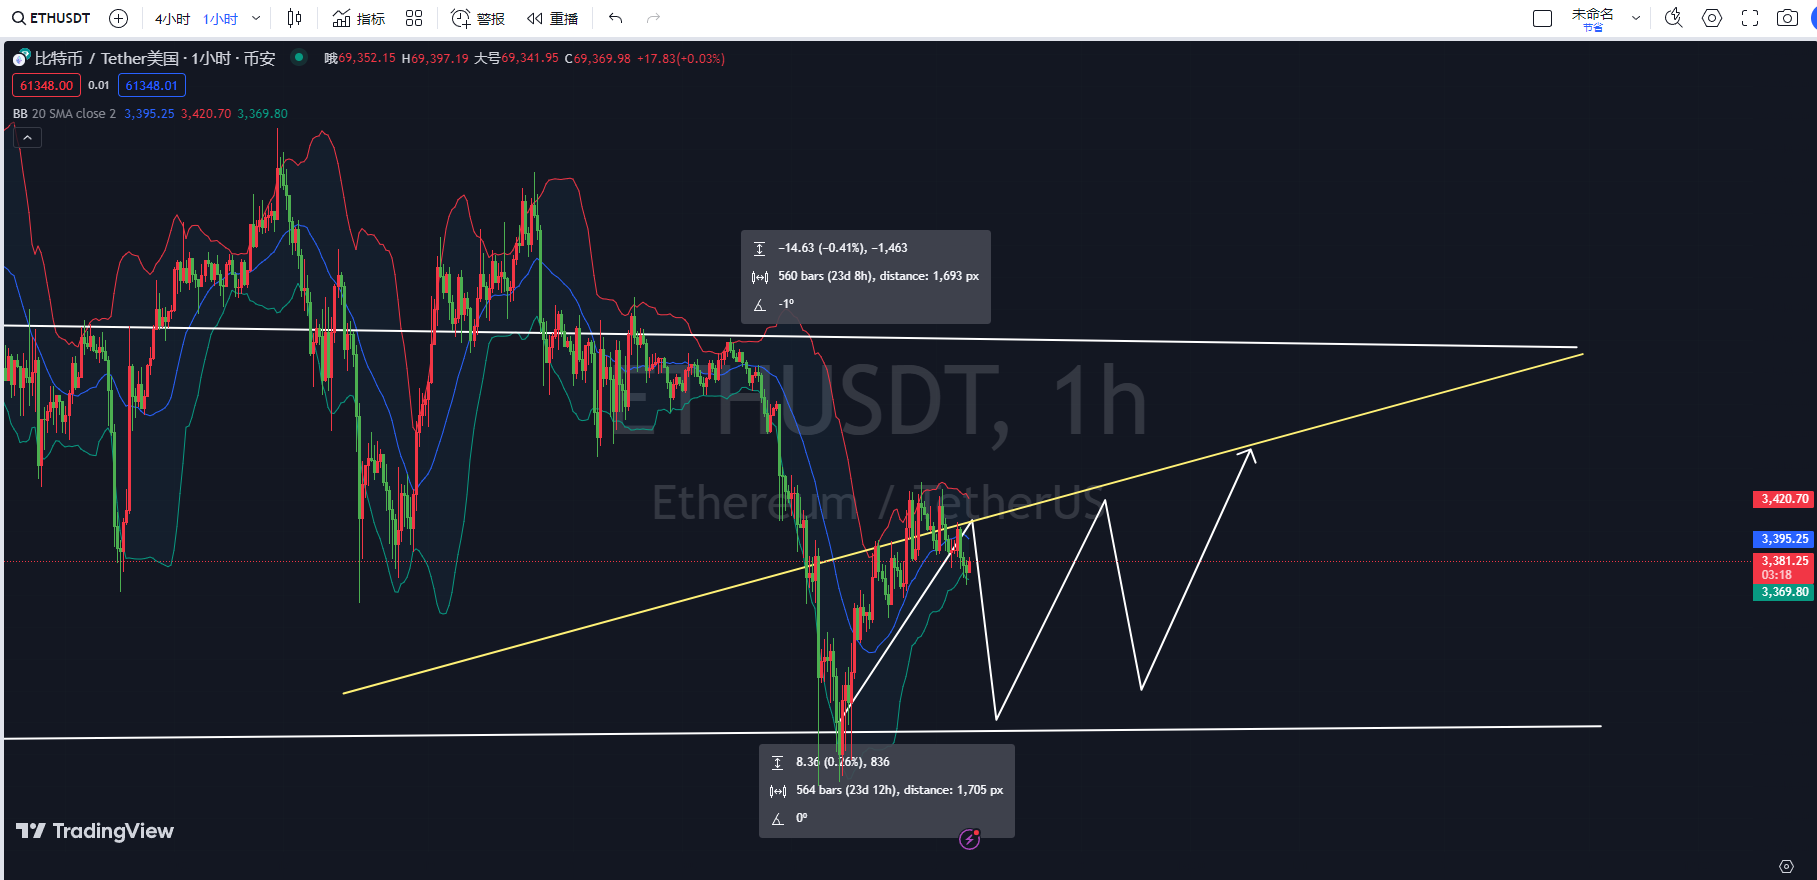
First, according to the Bollinger Bands indicator on the 1-hour chart of Ethereum, the current price is fluctuating near the lower band of the Bollinger Bands, and the Bollinger Bands are narrowing, indicating a decrease in market volatility. The distance between the upper and lower bands is narrowing, indicating that the market may enter a period of consolidation in the short term, and the price will not fluctuate significantly in the short term.
Second, according to the KDJ indicator on the 1-hour chart of Ethereum, the K line value and the D line value are currently hovering around 50, indicating that the market is currently in a state of consolidation with no clear trend direction. The J line value has retraced to a lower position and turned upward, indicating the possibility of a rebound in the short term.
Finally, according to the MACD indicator on the 1-hour chart of Ethereum, the DIF line and the DEA line are rising rapidly, indicating that the current price trend has some upward momentum. The green histogram of the MACD is also gradually shortening, indicating that the bullish momentum is starting to build in the short term.
Comprehensive analysis: According to the 4-hour chart, the KDJ indicator shows a short-term rebound signal, and the weakening bearish momentum in the MACD indicator also supports the possibility of a short-term rebound. The price may test the resistance level of 3,394, the middle band of the Bollinger Bands. If the price cannot stabilize at the middle band, the subsequent market may rely on the resistance of the middle band at 3,394 for short selling at high levels. According to the 1-hour chart, Ethereum is currently in a state of consolidation, and may fluctuate within the current price range in the short term, without a clear upward or downward trend.
In summary, Da Xian provides the following suggestions for reference:
Short Ethereum rebound to around 3,395-3,390, with a target of 3,338-3,280, and a defensive position at 3,420.
The Bitcoin strategy is to continue holding the short position of 61,190 given in Da Xian's article yesterday, with the take-profit point lowered to near 60,300.
Instead of giving you a 100% accurate recommendation, it's better to give you the correct mindset and trend, after all, teaching someone to fish is better than giving them a fish. The emphasis is on the mindset, grasping the trend, and planning the layout and position of the market. What I can do is to provide help based on my practical experience, so that your investment decisions and management can go in the right direction.
Drafting time: (2024-06-26, 19:20)
(By Da Xian Shuo Bi) Disclaimer: The publication on the internet has a delay, and the above suggestions are for reference only. The author is committed to research and analysis in the investment fields of Bitcoin, Ethereum, altcoins, foreign exchange, stocks, etc., and has been involved in the financial market for many years, with rich experience in actual trading operations. Investment involves risks, and entering the market requires caution. For more real-time market analysis, please follow Da Xian Shuo Bi for discussion and exchange.
免责声明:本文章仅代表作者个人观点,不代表本平台的立场和观点。本文章仅供信息分享,不构成对任何人的任何投资建议。用户与作者之间的任何争议,与本平台无关。如网页中刊载的文章或图片涉及侵权,请提供相关的权利证明和身份证明发送邮件到support@aicoin.com,本平台相关工作人员将会进行核查。


