Recently, all investors active in the cryptocurrency market have been focusing on when the Ethereum spot ETF will be approved by the SEC for listing. The market is also closely watching the progress of the S-1 registration statement. According to reports, all 8 applicants for the Ethereum spot ETF have reaffirmed July 2 as the issuance date for the ETF.
The Ethereum ETF provides many new buyers with the opportunity to allocate Bitcoin in their investment portfolios, leading to a significant increase in the price of Bitcoin. Since BlackRock submitted the Bitcoin ETF application, the price of Bitcoin has risen from around $25,000 to approximately $64,500, resulting in a return rate of 2.6 times. Will the approval of the Ethereum spot ETF further boost the price of Ethereum?
Ethereum Daily Chart
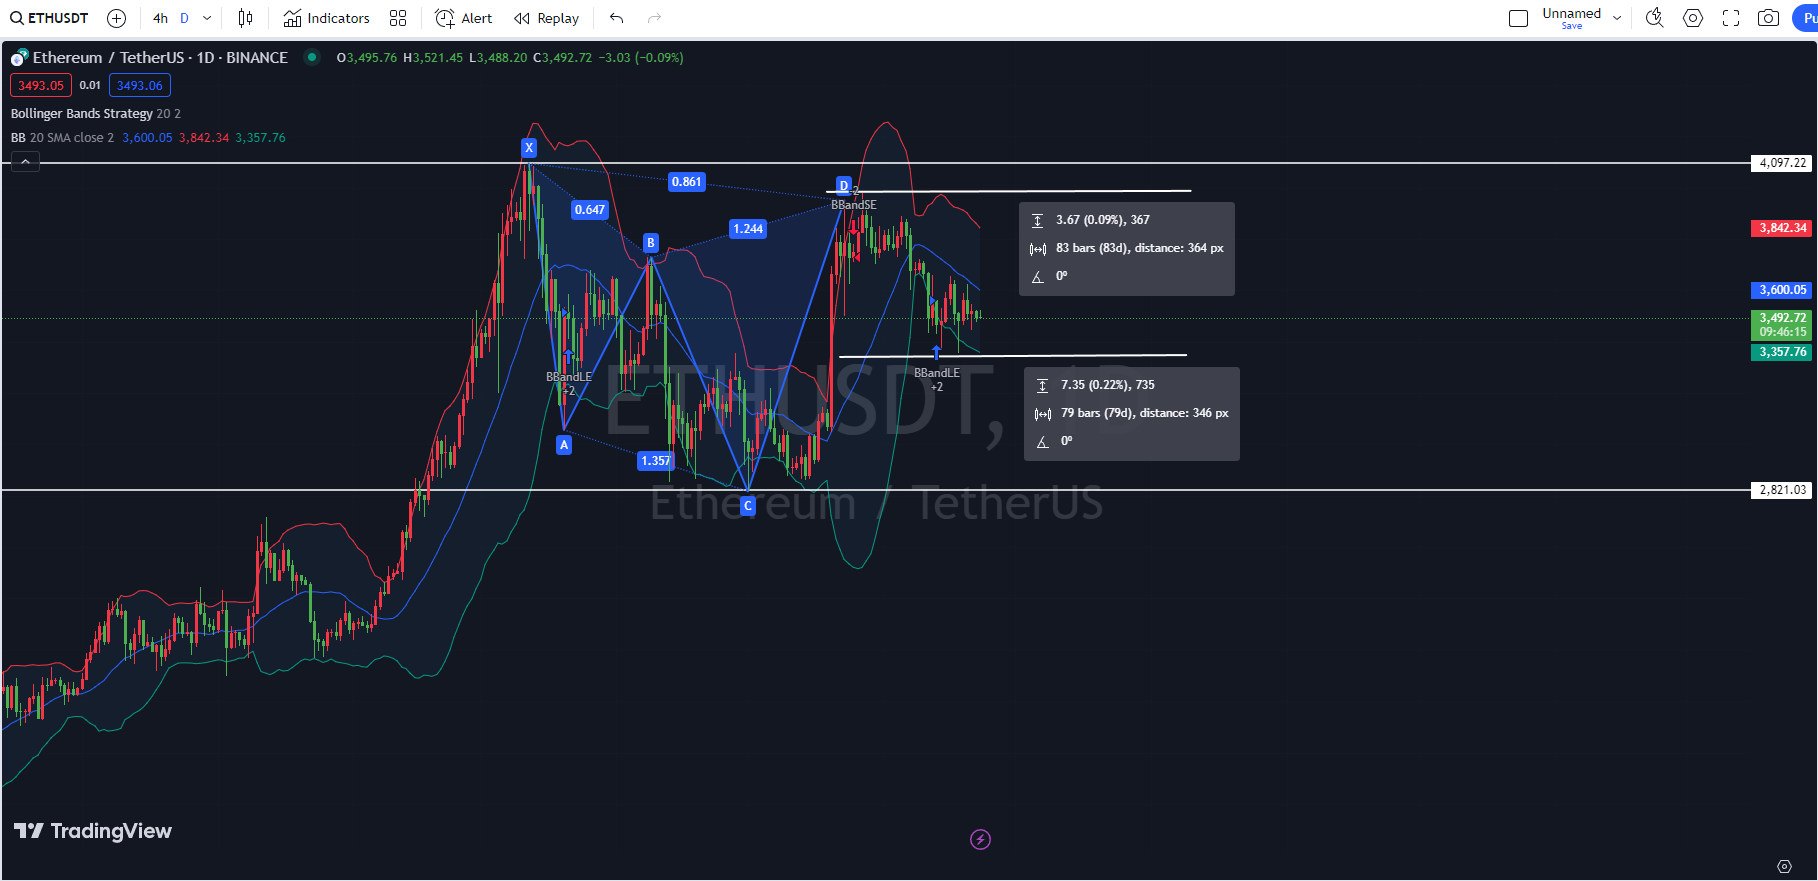
Looking at the Ethereum daily chart, the current price of Ethereum is running between the middle and lower bands of the Bollinger Bands, showing a trend of consolidation. The upper and lower bands are gradually narrowing, indicating a decrease in market volatility, which may lead to a brief period of consolidation. If the price can effectively break through the middle band, there may be further upward potential.
Furthermore, based on the KDJ indicator on the Ethereum daily chart, the KDJ three-line values show signs of a decline from the high levels. The K-line and D-line values are running near 50, and the J-line is hovering at high levels, indicating that after a wave of increase, the market may require an adjustment or pullback.
Finally, based on the MACD indicator on the Ethereum daily chart, the current DIF line is running downward after intersecting with the DEA line, and both are running below the zero axis, indicating a relatively weak market trend and the potential for further decline. However, the green histogram of the MACD is starting to shorten, indicating a weakening downward momentum, but the bearish trend still exists.
Ethereum 4-Hour Chart
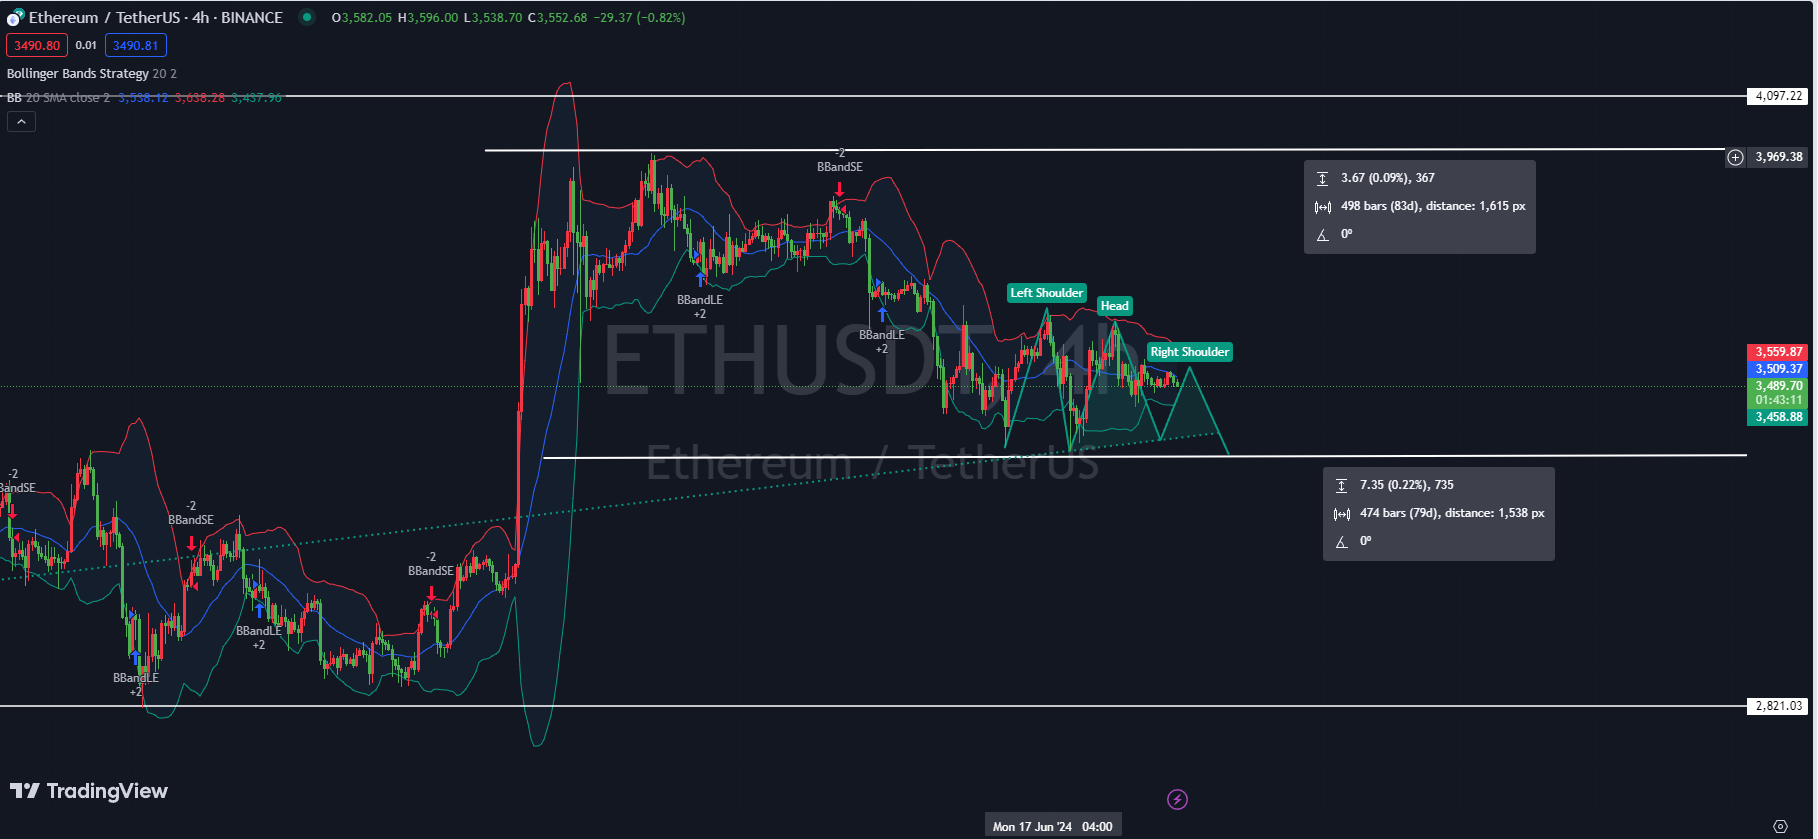
Looking at the Ethereum 4-hour chart, the current price of Ethereum is running near the middle band of the Bollinger Bands, and the Bollinger Bands are starting to narrow, showing a decrease in market volatility. The price is running near the middle band of the Bollinger Bands, and in the short term, it may test the resistance of the upper band. If it cannot break through, it will continue to fluctuate between the middle and lower bands.
Additionally, based on the KDJ indicator on the Ethereum 4-hour chart, the K-line and D-line values are running near 50, and the J-line value is slightly upward, indicating that the market is currently in a neutral state, without showing obvious oversold or overbought signals. However, the current upward movement of J may lead to a short-term price increase.
Finally, based on the MACD indicator on the Ethereum 4-hour chart, the DIF line and DEA line are close to sticking together below the zero axis, indicating that the market is in a relatively weak state. There are signs of the DIF line starting to turn upward, but there is no clear golden cross signal. The MACD histogram shows that the bearish momentum is weakening, but there is no clear bullish reversal signal.
Comprehensive Analysis: The trend of Ethereum on the 4-hour chart shows that there may be some opportunities for a small upward movement in the short term, but overall, the market sentiment remains relatively neutral. Looking at the daily chart, the MACD shows that there is still some downward pressure in the market, the KDJ shows signs of a pullback from the high levels, and a pullback may occur in the short term. The Bollinger Bands show a decrease in market volatility, and a period of consolidation may occur in the short term.
In conclusion, the following advice is given by the expert:
Short Ethereum near 3500, with a target of 3420 and a defensive position at 3530.
Instead of giving you a 100% accurate recommendation, it's better to provide you with the correct mindset and trend. After all, teaching someone to fish is better than giving them a fish. The suggestion is to focus on the mindset, grasp the trend, and plan the layout and position of the market. What I can do is to use my practical experience to help everyone make investment decisions and manage operations in the right direction.
Drafting time: (2024-06-23, 21:30)

(By - Da Xian Shuo Bi) Special Note: The publication on the internet may have a delay. The above suggestions are for reference only. The author is dedicated to research and analysis in the investment fields of Bitcoin, Ethereum, altcoins, foreign exchange, stocks, and has been involved in the financial market for many years, possessing rich experience in actual trading operations. Investment involves risks, so entry into the market should be cautious. For more real-time market analysis, please follow Da Xian Shuo Bi for discussion and exchange.
免责声明:本文章仅代表作者个人观点,不代表本平台的立场和观点。本文章仅供信息分享,不构成对任何人的任何投资建议。用户与作者之间的任何争议,与本平台无关。如网页中刊载的文章或图片涉及侵权,请提供相关的权利证明和身份证明发送邮件到support@aicoin.com,本平台相关工作人员将会进行核查。


