June 19th Air Cut: Bitcoin Slowly Falling Must Have Tricks, Waiting for Bottom Fishing Opportunity!
The market is always beyond control, and it takes time for a freeze to set in. People always like to find reasons to comfort their wounded souls after shorting, seeking a sense of emptiness. I may be someone you can do without. People always feel happy when making a profit, but they also worry when holding a profitable position. They argue with loved ones, confide in strangers, complain to those who treat them well, and feel good about those who deceive them. People always expect to be understood but fear being exposed.

BTC/Daily Chart
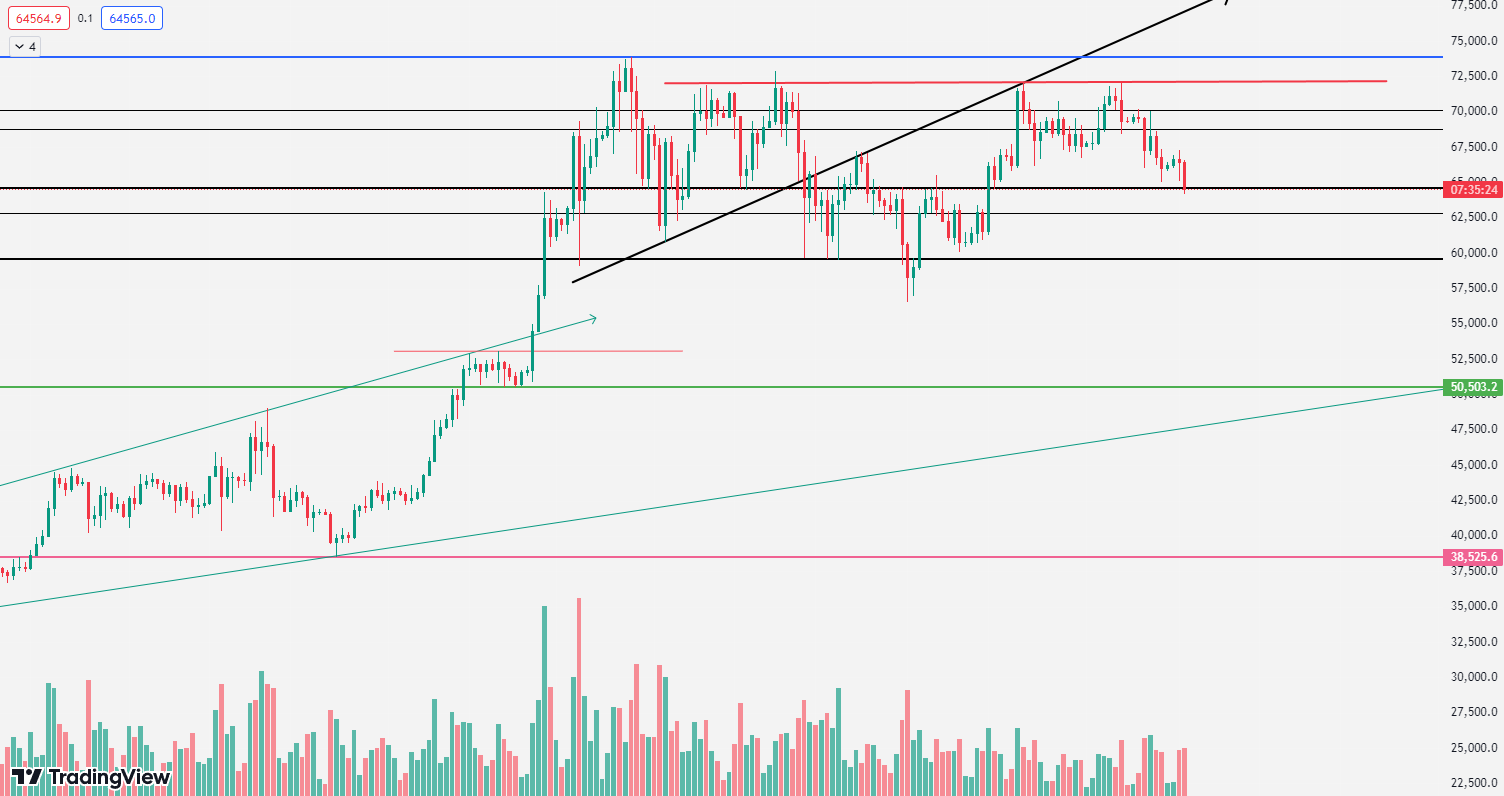
On the daily chart of Bitcoin, yesterday's candle closed lower, and the rebound stabilized near the lower-middle rail around 67300 before coming under pressure and falling. As of now, the price has dropped to a low of around 64261. It still needs to be observed whether it can effectively stabilize. If it forms a large bullish candle and breaks through the key resistance at 67300, then in the following days, there is a chance to challenge the resistance at the middle rail of 68500. Conversely, if it continues to fluctuate like last Friday, then it may easily continue to cycle between bullish and bearish, creating a pattern of fluctuation between positive and negative.
BTC/4H Chart
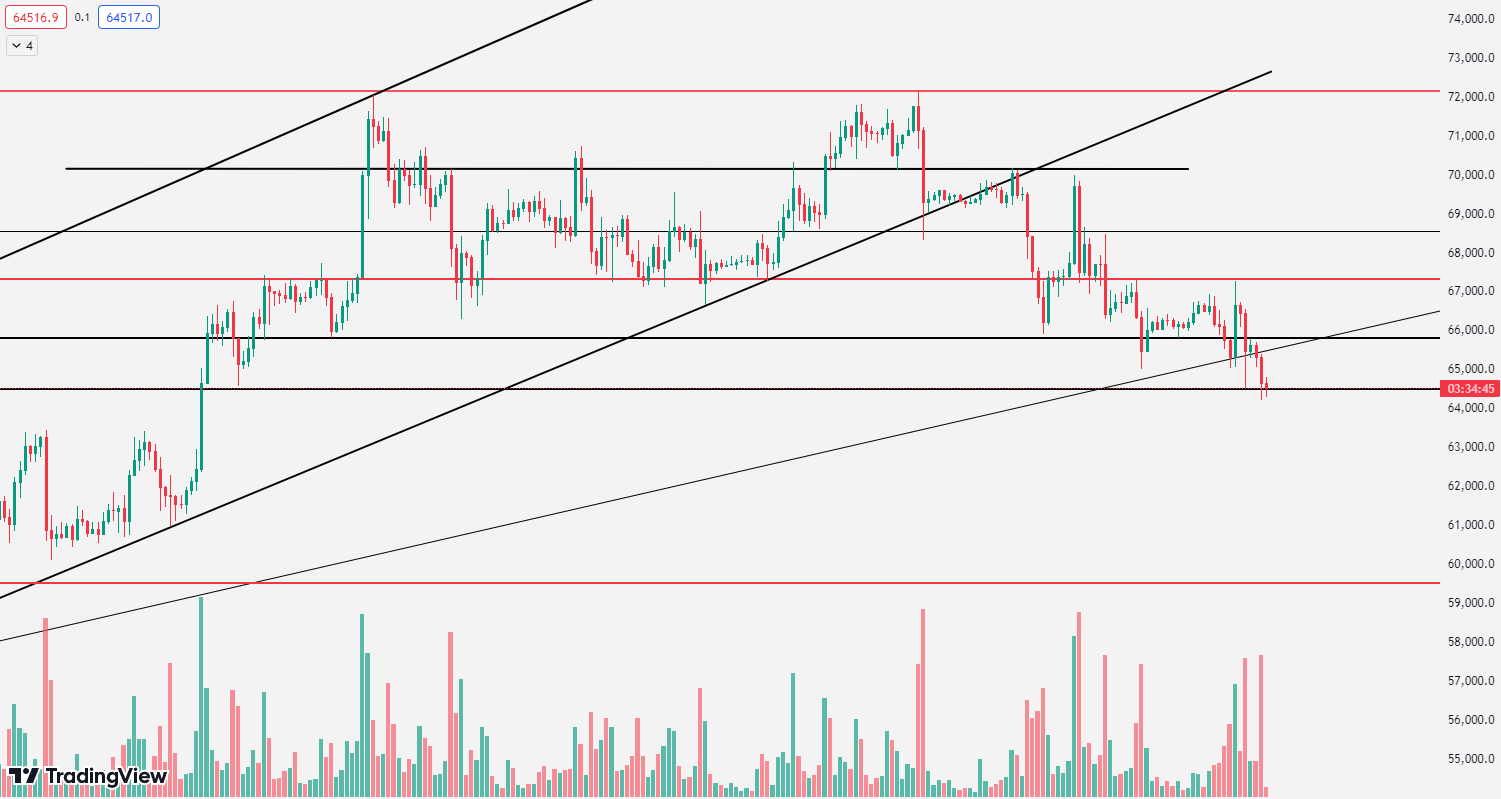
On the 4-hour chart of Bitcoin, it is worth noting that if the price breaks through today's high of 66600 after combining with the daily chart, the MACD is likely to form a bearish divergence and suppress a fall. It is expected to continue to oscillate, with the range constantly changing. The resistance at 67300 is also a key watershed for long and short positions. If it fails to rise above 66600 tonight, there may be a sell signal, and a short-selling strategy can be considered.
BTC/1H Chart
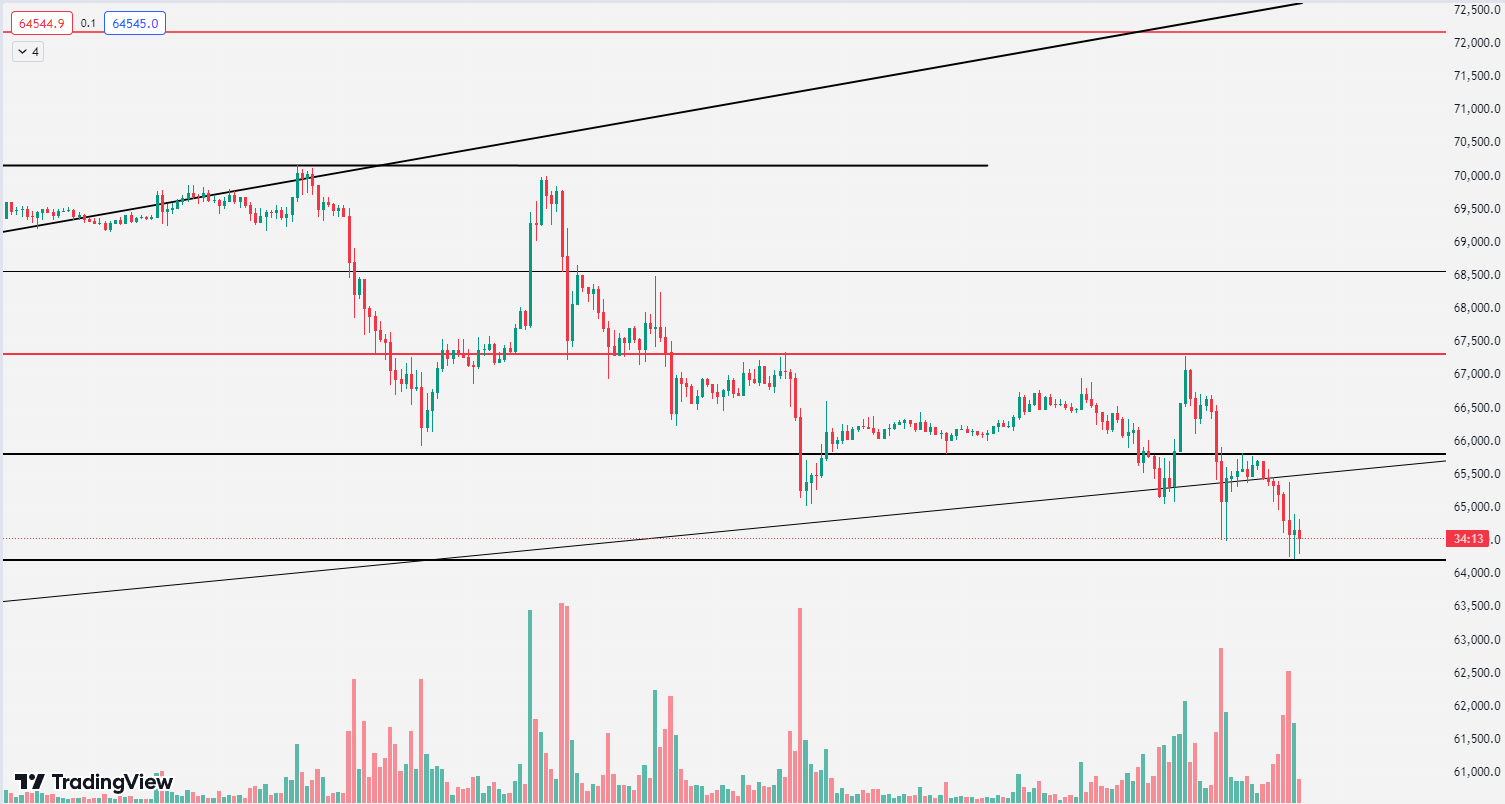
On the 1-hour chart of Bitcoin, as shown in the chart, the price fell from 67300 to around 64260 early this morning, breaking through the support at 65000-64500. Although it broke through, the downward momentum of the candlestick belongs to a slow decline, not an accelerated drop after the breakthrough. The temptation is strong. The author believes that the downward momentum of the market tonight will not be too great, and there are also buying signals. It is important to defend and control positions.
Strategy 1: Long at 64000-64500 (light position), add at 63500, stop loss at 63000, target around 65800-66000
Strategy 2: Short in batches at 66900-66600, stop loss at 67300, target around 65000-64500
The above are personal suggestions for reference only. Investment involves risks, and trading should be cautious.
There may be delays in publishing, and the market changes in an instant. The mentioned points in the article do not serve as a basis for following orders. For more information on the market and order execution, please refer to real-time strategies for short selling.
Scan and follow the public account below for comprehensive guidance: Pionex

Comprehensive guidance time: 7:00 AM to 2:00 AM the next day
This article is original and has been created by Pionex, with over ten years of investment experience, having handled funds at the level of tens of millions, familiar with the operation of main funds, washing and absorbing chips, and boosting techniques. It can grasp the combination of knowledge and action in fund management, position control, investment portfolio, and investment mentality. Proficient in judging and analyzing the overall market trend, mastering various candlestick technical tactics, and having deep insights into wave theory, pattern theory, and indicator theory. Scan and follow the public account above for technical market learning and communication.
免责声明:本文章仅代表作者个人观点,不代表本平台的立场和观点。本文章仅供信息分享,不构成对任何人的任何投资建议。用户与作者之间的任何争议,与本平台无关。如网页中刊载的文章或图片涉及侵权,请提供相关的权利证明和身份证明发送邮件到support@aicoin.com,本平台相关工作人员将会进行核查。


