Based on the 4-hour chart of GME/USDT shown in the above figure, we can make the following analysis and predictions:
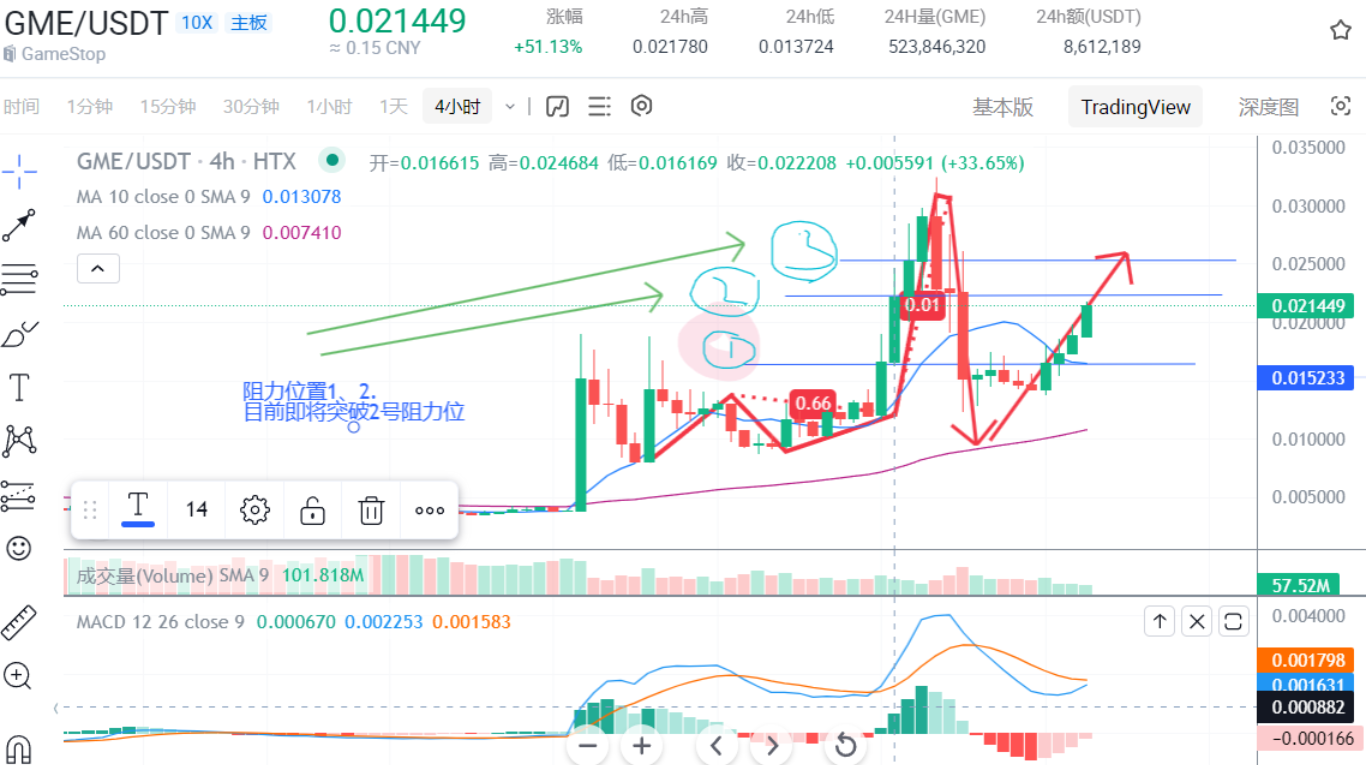
Overall Trend: The chart shows that GME/USDT has recently experienced a significant increase, with the current price fluctuating around 0.021449 USDT, representing an increase of over 50%. Market sentiment is bullish, and the price has risen rapidly after breaking through the previous resistance level.
Technical Indicators:
- Moving Averages (MA): The short-term moving average (MA 10, blue line) is above the long-term moving average (MA 60, pink line), indicating a clear bullish trend.
- MACD Indicator: In the MACD indicator, both the blue line (MACD line) and the orange line (signal line) are above the zero axis, and the MACD line is above the signal line, with the histogram being green, indicating strong buying pressure and the potential for further upward movement in the market.
Key Levels Analysis:
- Resistance Levels: The chart indicates two key resistance levels, and the current price is about to break through the second resistance level. If successful, the price is likely to further increase, with a potential target of 0.025000 USDT.
- Support Levels: The current support level is around 0.015233 USDT, and the price has received support and rebounded at this level multiple times, indicating a relatively stable support level.
Volume: The volume shows a significant increase in buying volume during the rapid price increase, indicating that market participants are optimistic about the future trend of GME/USDT.
Future Predictions:
- Short-term: If the price can effectively break through the current resistance level of 0.022000 USDT, it is expected to further increase in the short term, with a potential target of the next resistance level at 0.025000 USDT.
- Medium-term: During the price increase, if a pullback occurs, attention should be paid to the support level at 0.015233 USDT. If this support level can remain stable, the price is likely to continue to rise after the adjustment.
Investment Advice: The current market trend is bullish, suitable for trend-following and buying on dips. It is recommended for investors to pay attention to the breakthrough of the resistance level. If the price can effectively break through the resistance level, consider adding to positions. At the same time, pay attention to changes in market dynamics and technical indicators to assess the continuity of the trend and adjustment risks.
Final Reminder: Investment involves risks, so caution is advised when entering the market. For more information, please follow us!
Having experienced the ups and downs of the coin circle for many years, I am sharing my experience and strategies. If you are unsure about what to do, follow my official account: Web Mountain and Beyond, to get the latest updates! Unlock the password for the CF and join the community to learn and discuss together, covering price points, market directions, position distribution, and selecting potential coins.
免责声明:本文章仅代表作者个人观点,不代表本平台的立场和观点。本文章仅供信息分享,不构成对任何人的任何投资建议。用户与作者之间的任何争议,与本平台无关。如网页中刊载的文章或图片涉及侵权,请提供相关的权利证明和身份证明发送邮件到support@aicoin.com,本平台相关工作人员将会进行核查。


