Only with a calm mind can one achieve great success in investment. Everything else is just empty talk. Making money is the ultimate goal. Hello everyone, I am Jinrui from the cryptocurrency circle!
[BTC Daily Chart]
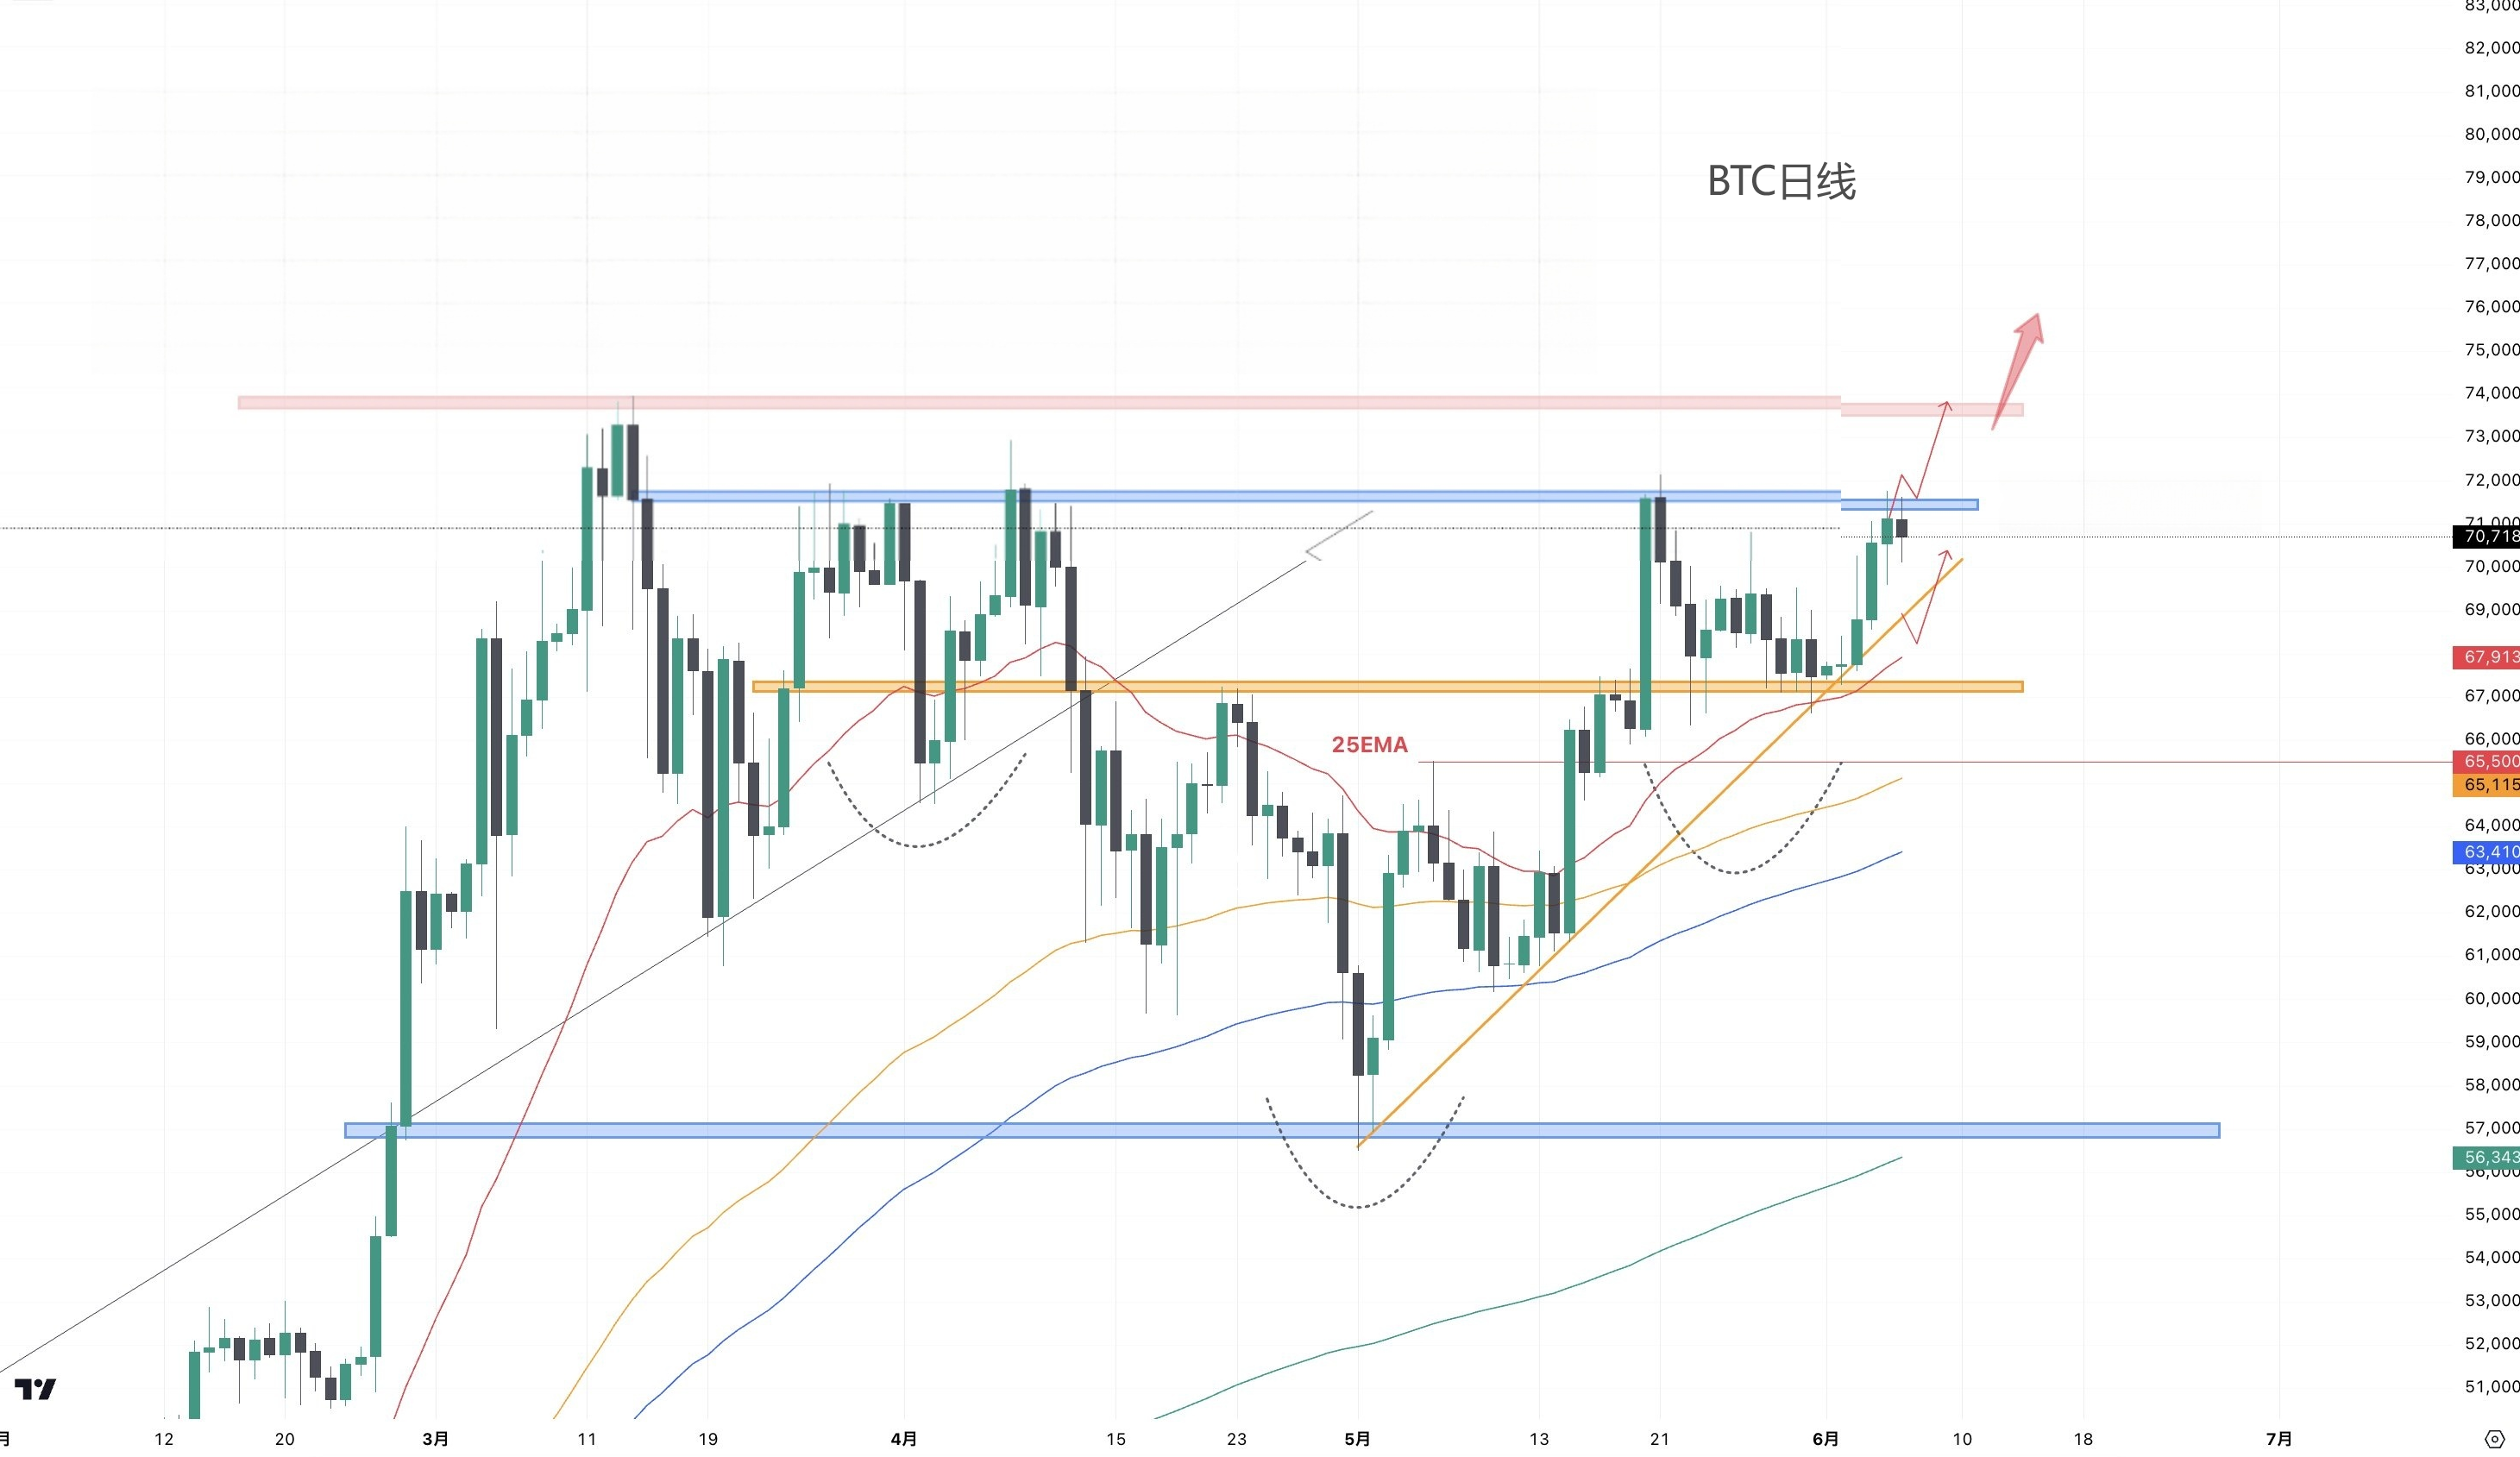
As Jinrui predicted yesterday, Bitcoin failed to break through the neckline near $71,700, leading to a price drop. Therefore, the possibility of a significant breakthrough will depend on today's non-farm payroll data.
Due to the continuous upward movement of the low point, Jinrui remains bullish. Considering the narrowing distance of the 25EMA on the daily chart, it is recommended to enter the market after a timely short-term adjustment.
Neckline at $71,700: This is a key resistance level. Failure to break through here indicates potential downward pressure on the market.
Non-farm payroll data: The upcoming employment data release may have a significant impact on the market trend.
Continuous upward movement of the low point: This phenomenon usually indicates that the overall market trend is still upward.
25EMA: This is the 25-day Exponential Moving Average, used to assess the market's medium-term trend and support/resistance levels.
Despite a drop of about $1,000, the overall trend remains bullish. As shown in the chart, the bullish trend can be maintained until the price falls below the 25EMA at the daily level.
[BTC 4-hour Chart]
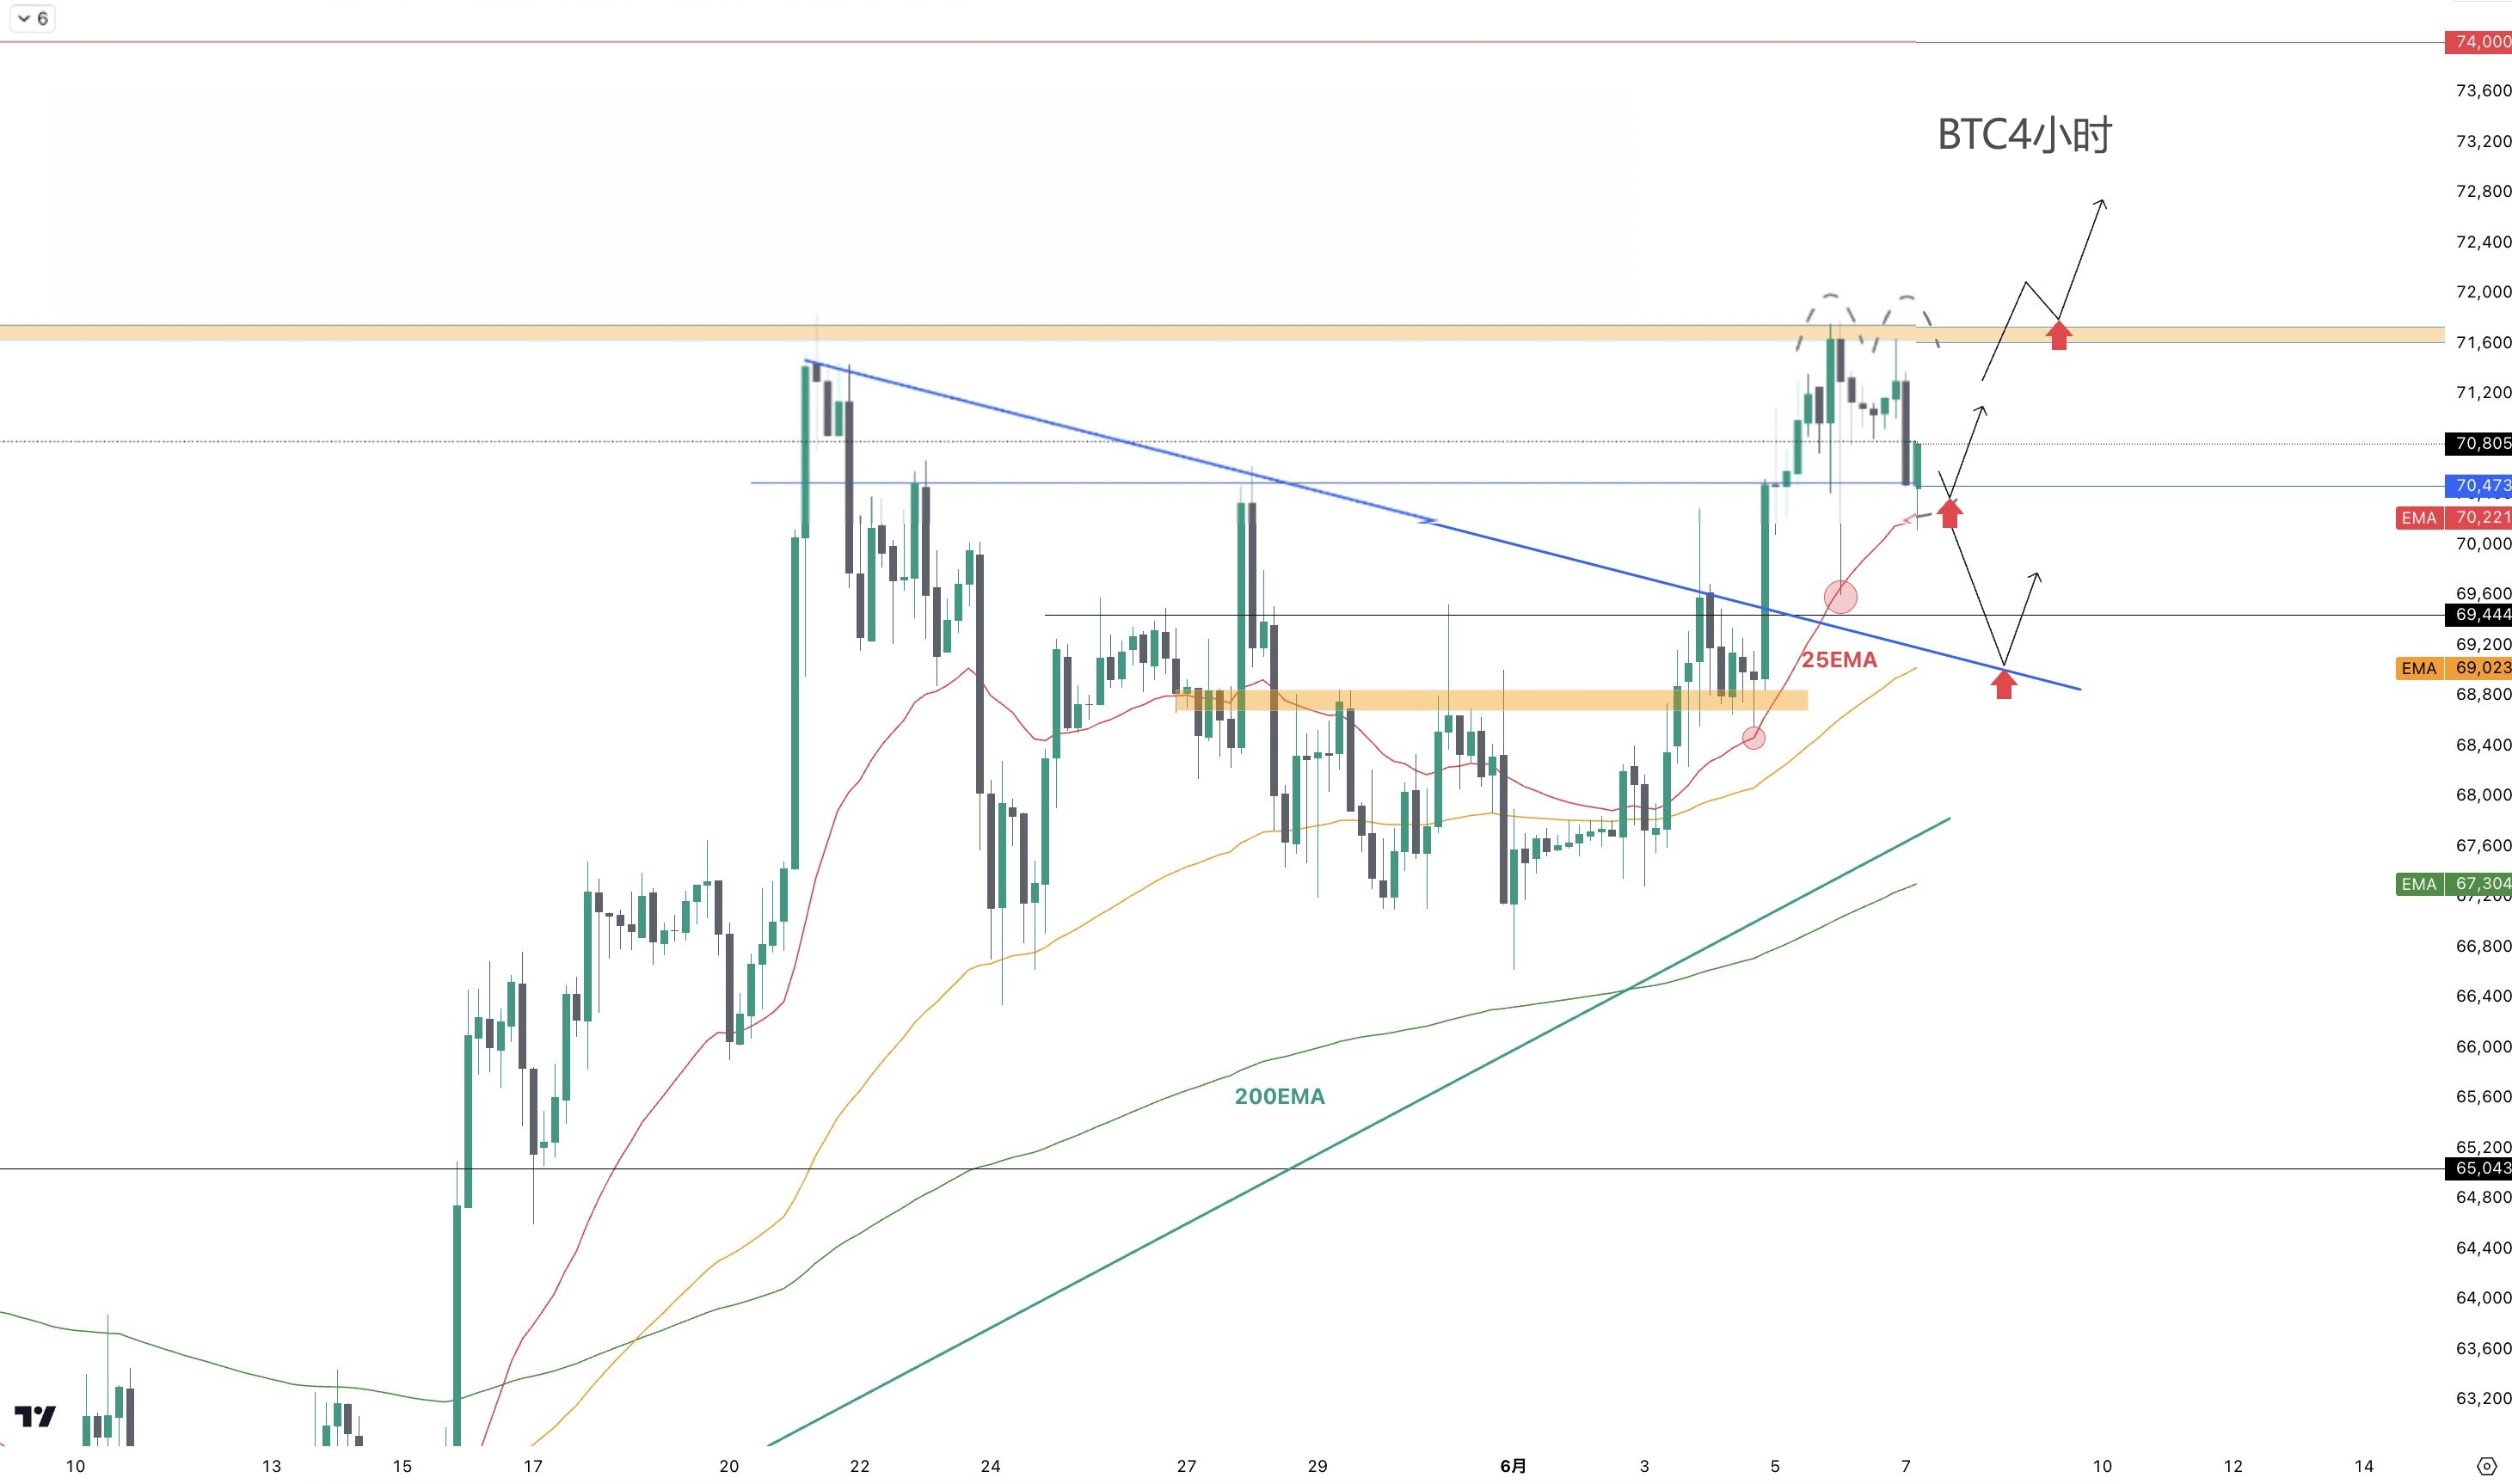
The current trend on the 4-hour chart shows a formation of a double top pattern, with the 25EMA providing support. Overall, the trend remains bullish until the price falls below the 25EMA.
However, if it breaks below, Jinrui expects a drop of approximately $1,000 (close to the upper range of the triangle consolidation area, around $69,000).
Before the release of non-farm payroll data, the market is expected to show a slow and oscillating trend. Therefore, the ideal strategy is to wait for the price to fall to key levels before entering the market.
Key levels to watch for in medium-term trading:
25EMA on the 4-hour chart
$69,000
$71,700
[BTC 1-hour Chart]
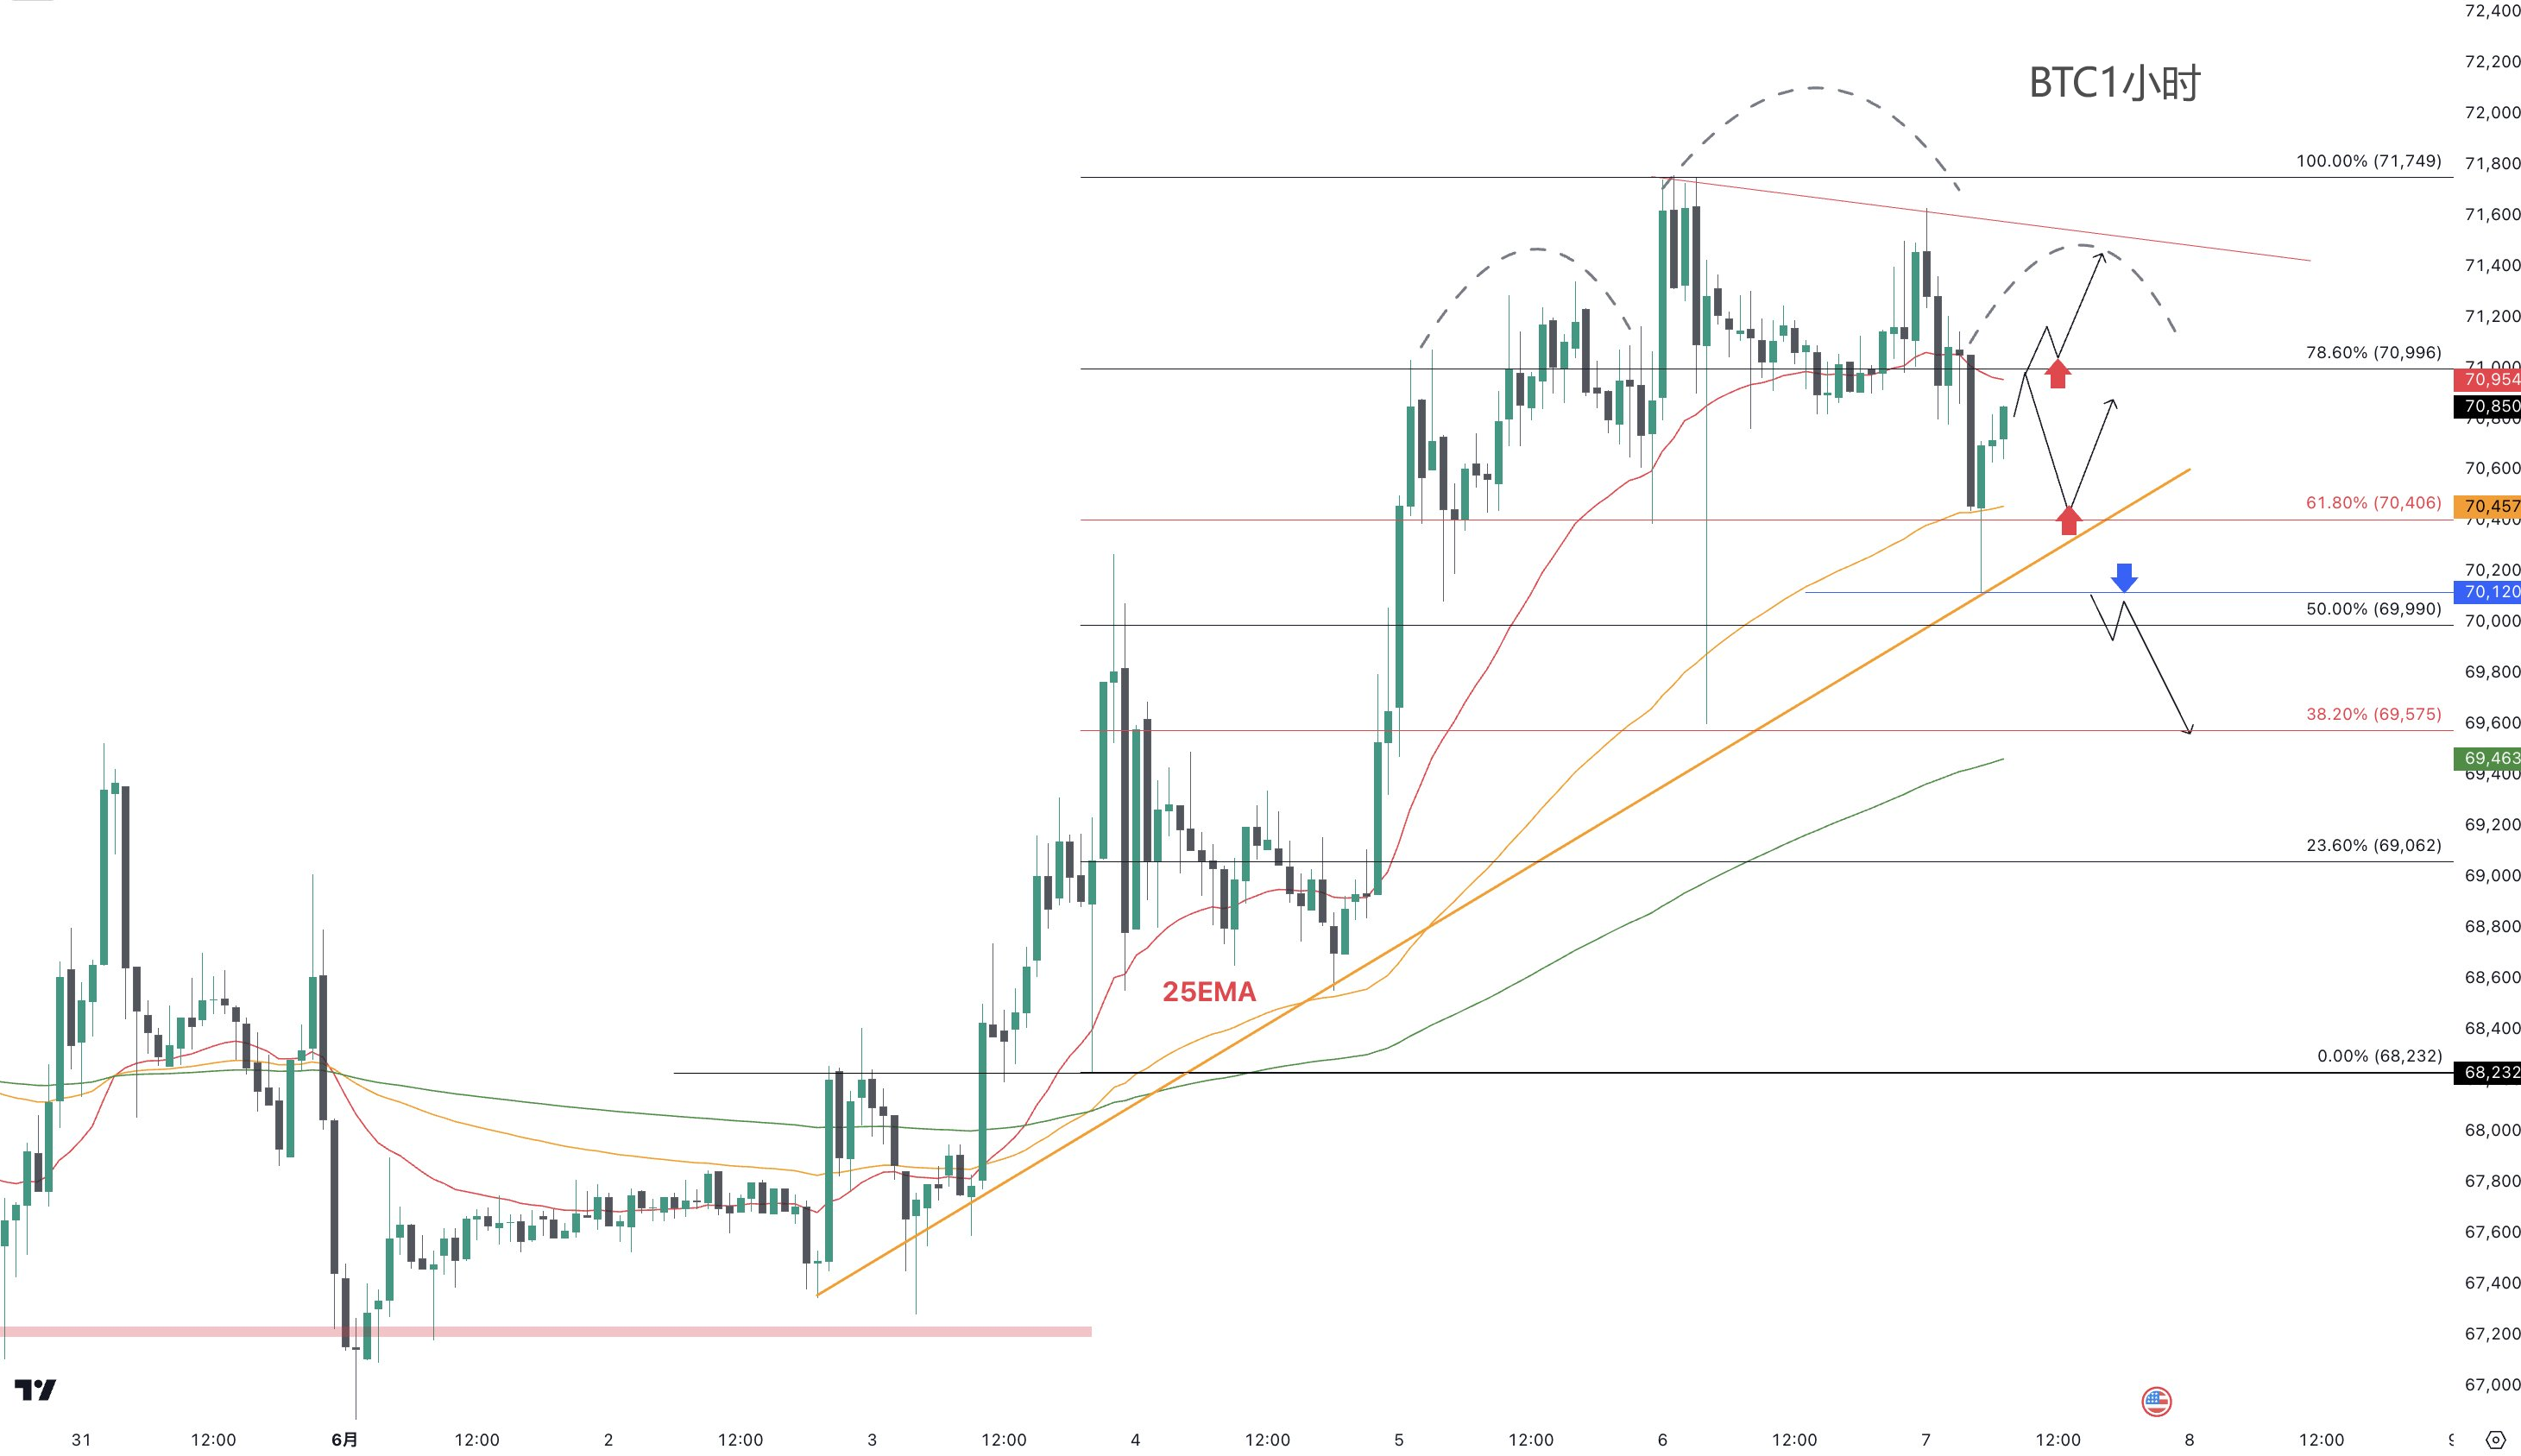
In the short term, as the trading points are more refined, Jinrui suggests combining the 4-hour chart for entry operations.
~Ultra-short-term Entry Points~
Long position entry at the 61.8% Fibonacci retracement level ($70,400)
Target: $70,990, $71,500
Stop loss: $70,100
Long position entry with support from the 25EMA on the 1-hour chart ($71,000)
Due to a previous price break, it is recommended to trade with a small position
Target: $71,600
Short position entry following a breakthrough of the recent low point ($70,100)
Stop loss: $70,500
Target: $69,200-$69,000
If you want to receive real-time information later, please like & share to let me know 🙌🏻. If this is helpful to you, I hope you can like it ❤️ and follow me, looking forward to your support.
I have years of in-depth research on spot contracts, BTC, ETH, and various altcoins. If you are experiencing difficulties in trading or long-term losses, or if your trades are stuck, you can follow my public account (Jinrui in the cryptocurrency circle). Investment carries risks, so be cautious when entering the market. With the daily market fluctuations, all I can do is to use my years of practical experience to help you make the right investment decisions and manage your operations in the right direction.

The advertisements at the end of the article and in the comments section are not related to me personally!! Please be cautious in distinguishing between true and false information. Thank you for reading.
免责声明:本文章仅代表作者个人观点,不代表本平台的立场和观点。本文章仅供信息分享,不构成对任何人的任何投资建议。用户与作者之间的任何争议,与本平台无关。如网页中刊载的文章或图片涉及侵权,请提供相关的权利证明和身份证明发送邮件到support@aicoin.com,本平台相关工作人员将会进行核查。


