Only with a calm mind can one achieve great success. Investing is only for making money, everything else is just empty talk. Making money is the only way. Hello everyone, I am Jinrui from the cryptocurrency circle!
Is Bitcoin about to enter a bull market? Jinrui will explain the reasons for the change on the daily chart below.
[BTC Daily Chart]
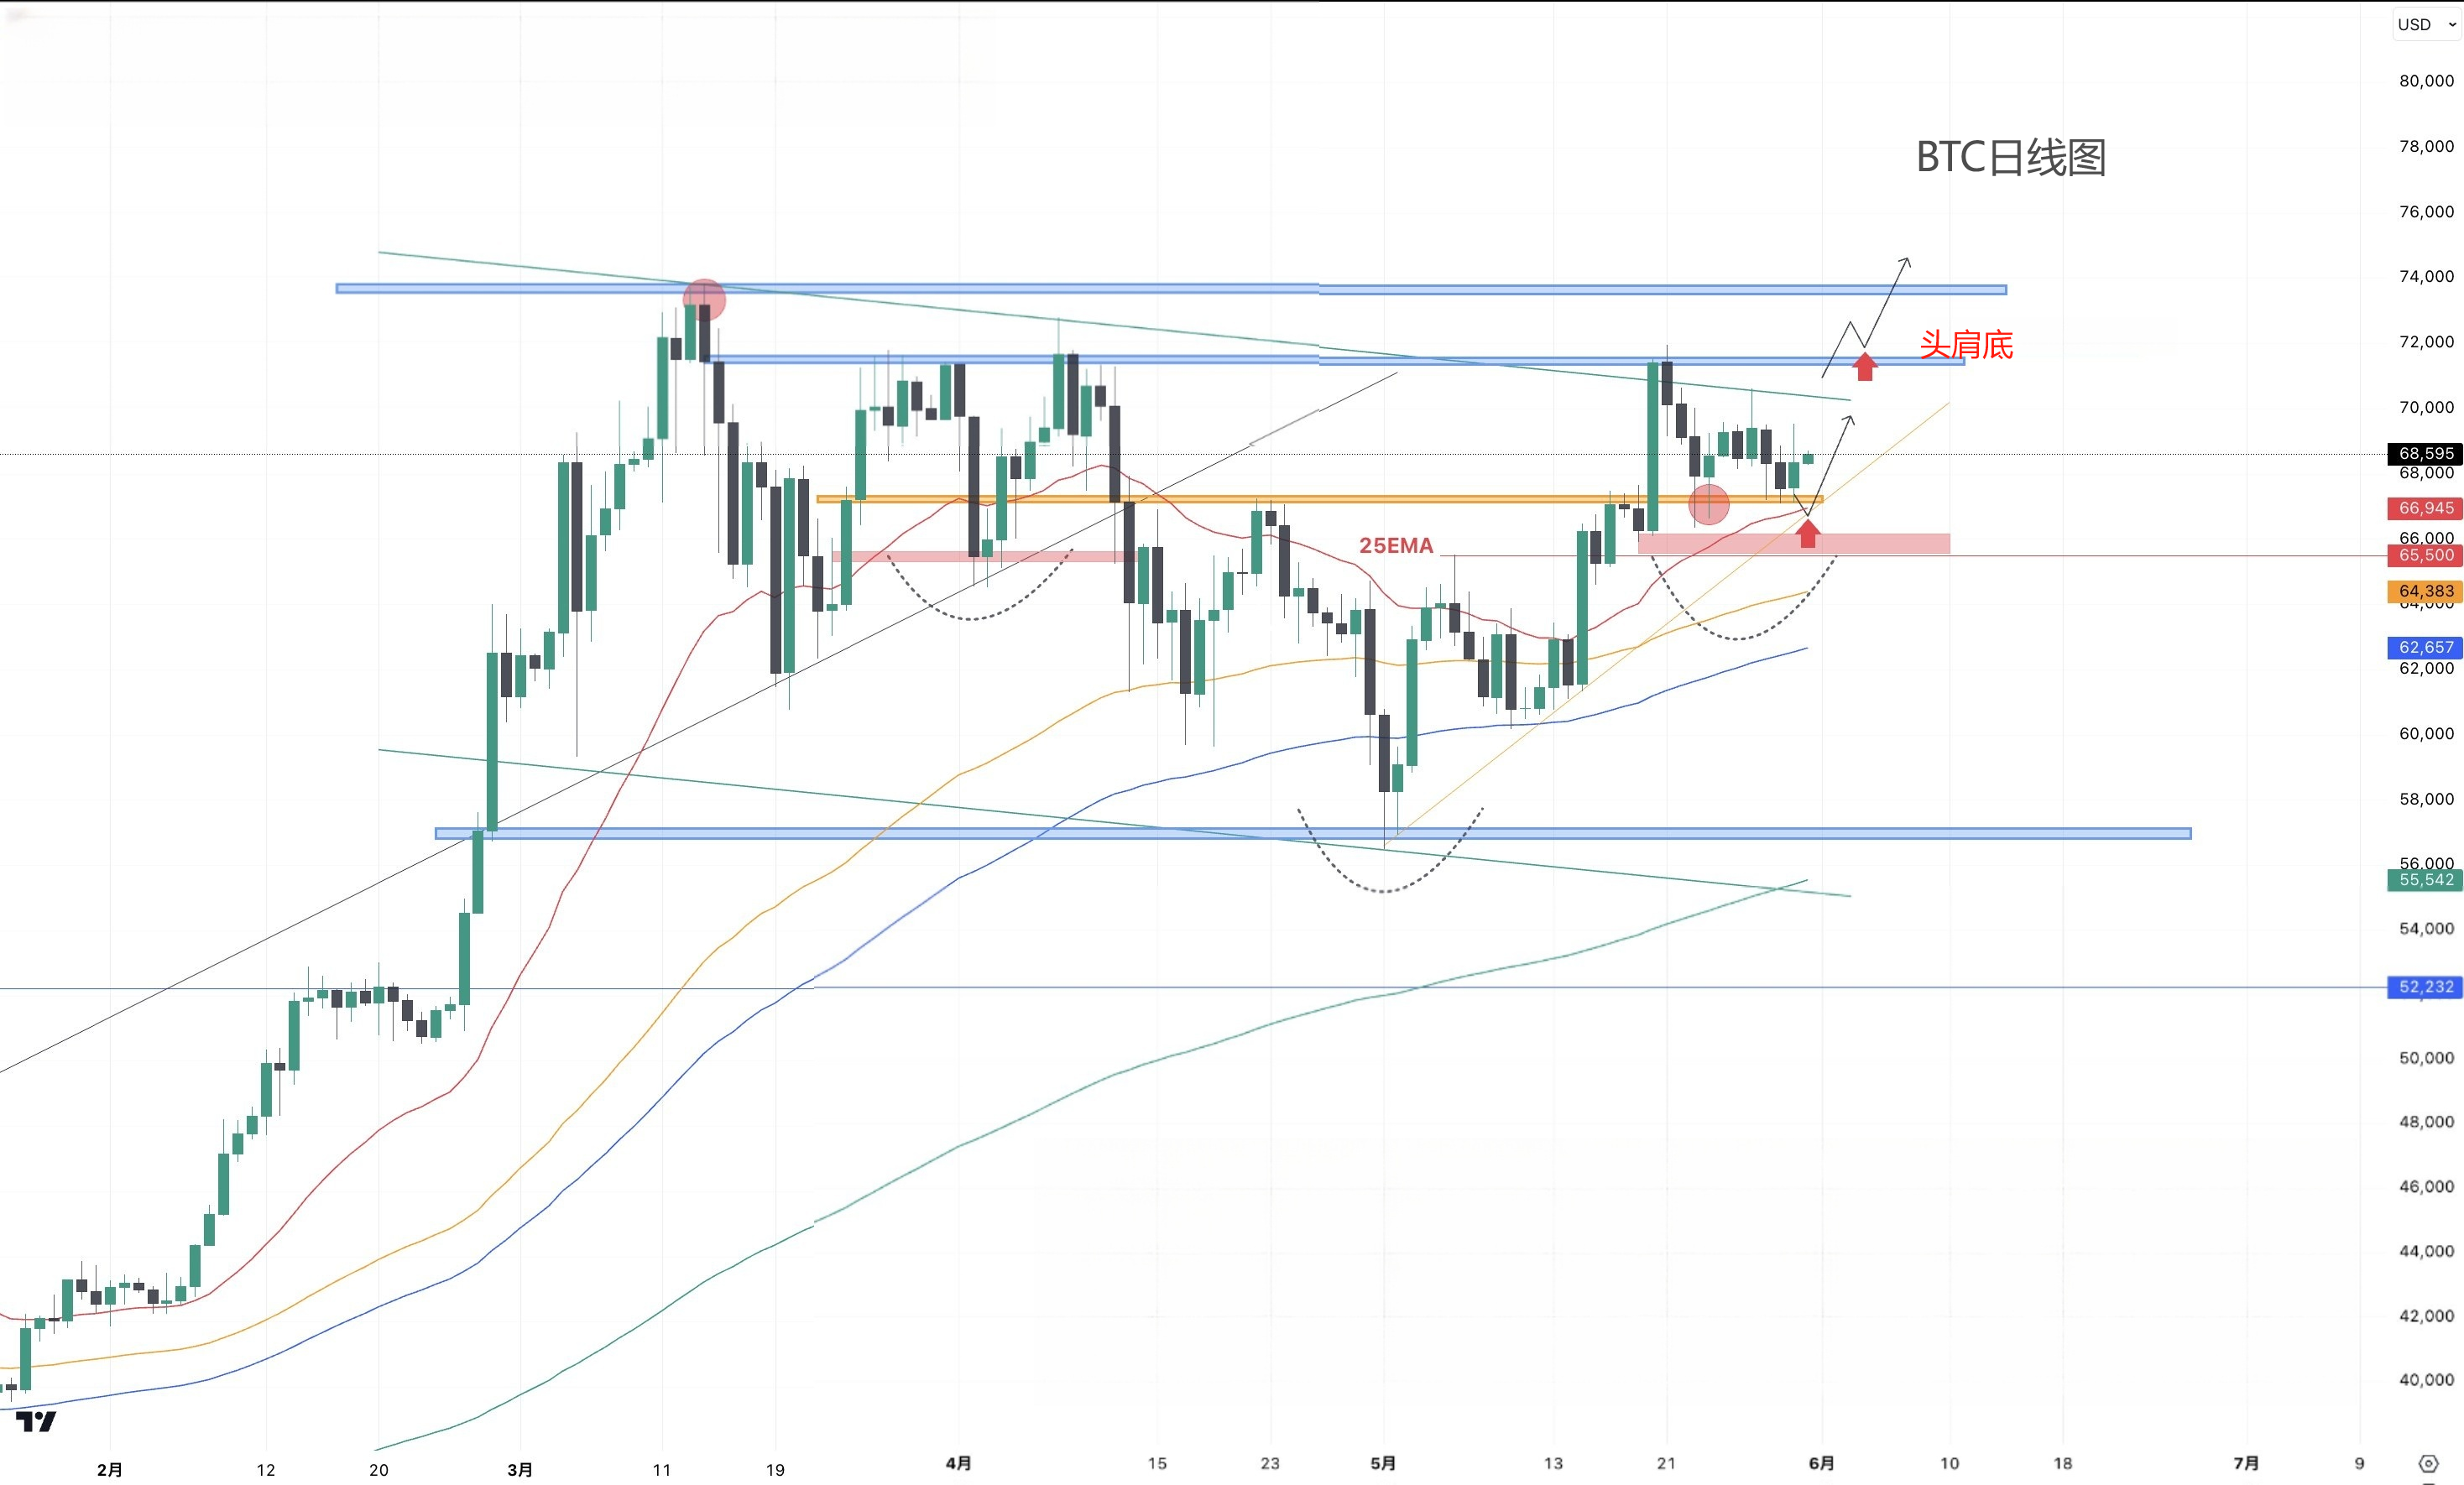
The daily chart continues to form the right shoulder of a head and shoulders bottom pattern, so whether it can break through the neckline is the key focus for the next step. The left shoulder may slightly increase the price range, so the 25EMA on the daily level (67,000 US dollars) and the top of the right shoulder (yellow area) are potential support points to consider.
On the daily chart, three signs have appeared indicating the possibility of a Bitcoin rally:
- The deviation from the 25EMA has been filled.
- The formation of the right shoulder of a head and shoulders bottom pattern.
- The recent upward trend line has been maintained.
Based on these three reasons, Bitcoin is expected to rise in the future. If the head and shoulders bottom pattern on the daily level is established, Jinrui believes that the upward target of "80,000 US dollars" is very likely.
Jinrui previously mentioned in an article that the 25EMA on the daily level is a potential support point and hopes that everyone can seize this opportunity.
[BTC 4-Hour Chart]
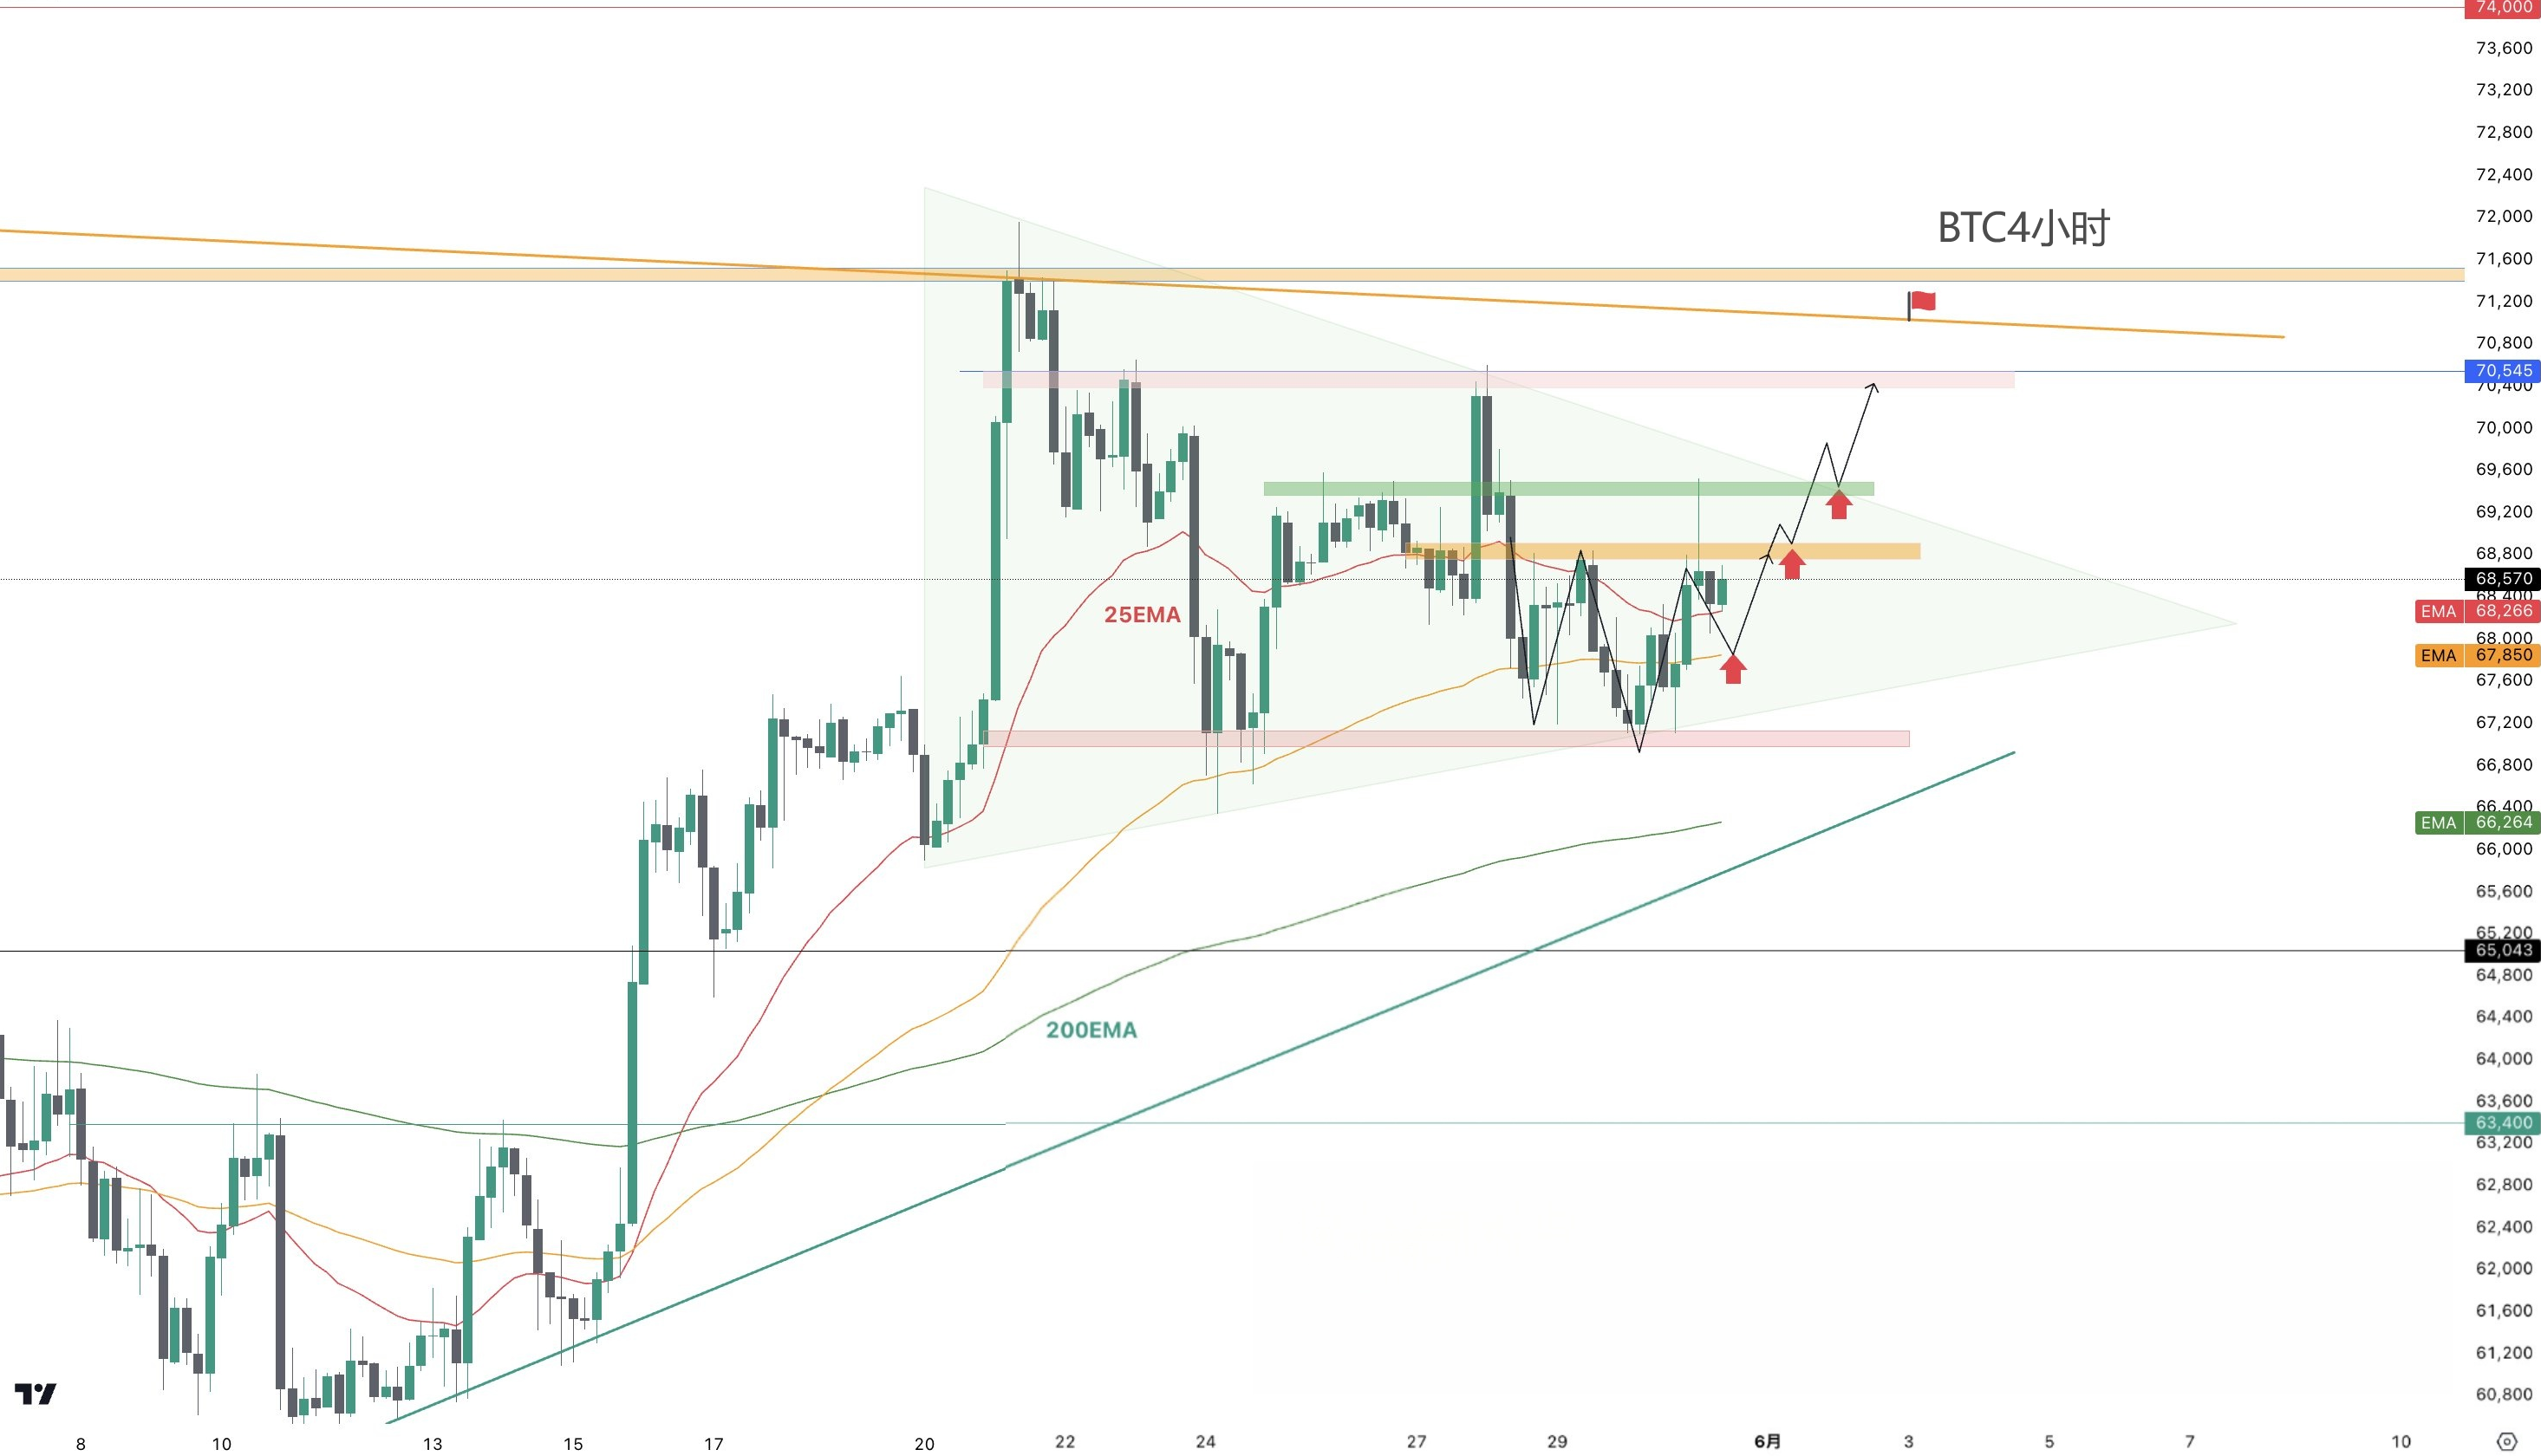
Looking at the 4-hour chart, although Bitcoin once fell below the support level, it has returned to the consolidation range, so the direction is not clear in the short term.
If the price breaks above the consolidation range, it may attempt to reach 70,000 US dollars. If it falls below the consolidation range, it may drop to 65,000 US dollars, and the maximum potential drop may be around 59,000 US dollars.
Now let's take a look at today's trading strategy. There are still signs of a "head and shoulders bottom" forming on the 4-hour chart.
Jinrui has two suggestions for friends with different risk preferences:
- Friends willing to take some risks to gain more profits can try to go long at the top of the right shoulder.
- Friends who want stability can wait to go long with the trend after breaking through the neckline.
Specific entry point suggestions are as follows:
- Go long when the 25EMA on the 4-hour chart provides support, with an entry price of 68,300 to 68,500 US dollars. The target price is 69,000 to 69,500 US dollars, and the stop loss is set below the 75EMA on the 4-hour chart, with a stop loss price of 67,900 US dollars. (Short-term trade)
- Buy long on the pullback in the orange area, with a buy price of 68,700 to 68,800 US dollars. The target price is 69,500 to 70,500 US dollars. The stop loss is set below the 25EMA on the 4-hour chart, with a stop loss price of 68,300 US dollars. (Medium-term trade)
~Short strategy~
If the right shoulder of the head and shoulders bottom pattern is invalidated, Jinrui believes that a double top pattern may form. Therefore, near the orange area of the neckline, around 68,700 to 68,800 US dollars, consider going short for risk hedging.
If you want to receive real-time information later, please like & share to let me know 🙌🏻. If this is helpful to you, I hope you can like ❤️ and follow, and look forward to your support.
I have years of in-depth research on spot contracts, BTC, ETH, and various altcoins. If you are not doing well in trading, experiencing long-term losses, or getting stuck in trades, you can follow my public account (Jinrui in the cryptocurrency circle). Investment involves risks, so be cautious when entering the market. The market fluctuates every day, and all I can do is to use my years of practical experience to help you make the right investment decisions and manage your operations in the right direction.

The end of the article and other advertisements in the comments section are not related to me personally!! Please be cautious in distinguishing between true and false information. Thank you for reading.
免责声明:本文章仅代表作者个人观点,不代表本平台的立场和观点。本文章仅供信息分享,不构成对任何人的任何投资建议。用户与作者之间的任何争议,与本平台无关。如网页中刊载的文章或图片涉及侵权,请提供相关的权利证明和身份证明发送邮件到support@aicoin.com,本平台相关工作人员将会进行核查。


