Only with a calm mind can one achieve great success in investment. Everything else is just empty talk, making money is the only way. Hello everyone, I am AICoin Jinrui!
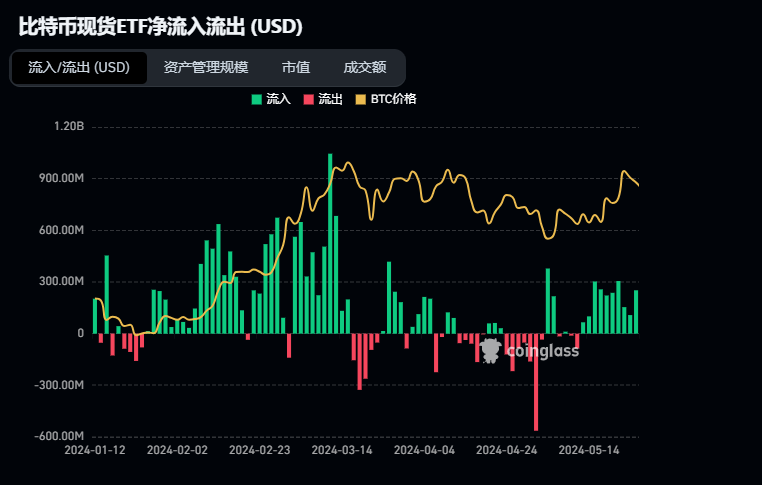
Currently, the inflow of BTC and ETH ETFs is increasing, and the reason for the increase is that US economic indicators suggest "slowing inflation." The current trend of Bitcoin is following the trend of US interest rates and stock indices.
Therefore, inflation indicators and the PCE price index are also factors that need to be considered.
'Two Reasons for the Changes in the Bitcoin Market'
Rising Rate Cut Expectations (US Indicators)
- Slowing inflation accelerates risk appetite.
Trump's Tough Stance on Cryptocurrency
- Cryptocurrency users are gaining attention in order to win votes in the presidential election.
In addition to these, it is also necessary to pay attention to fundamental factors such as the situation in the Middle East, which is also one of the reasons for this decline.
【BTC Daily Chart】
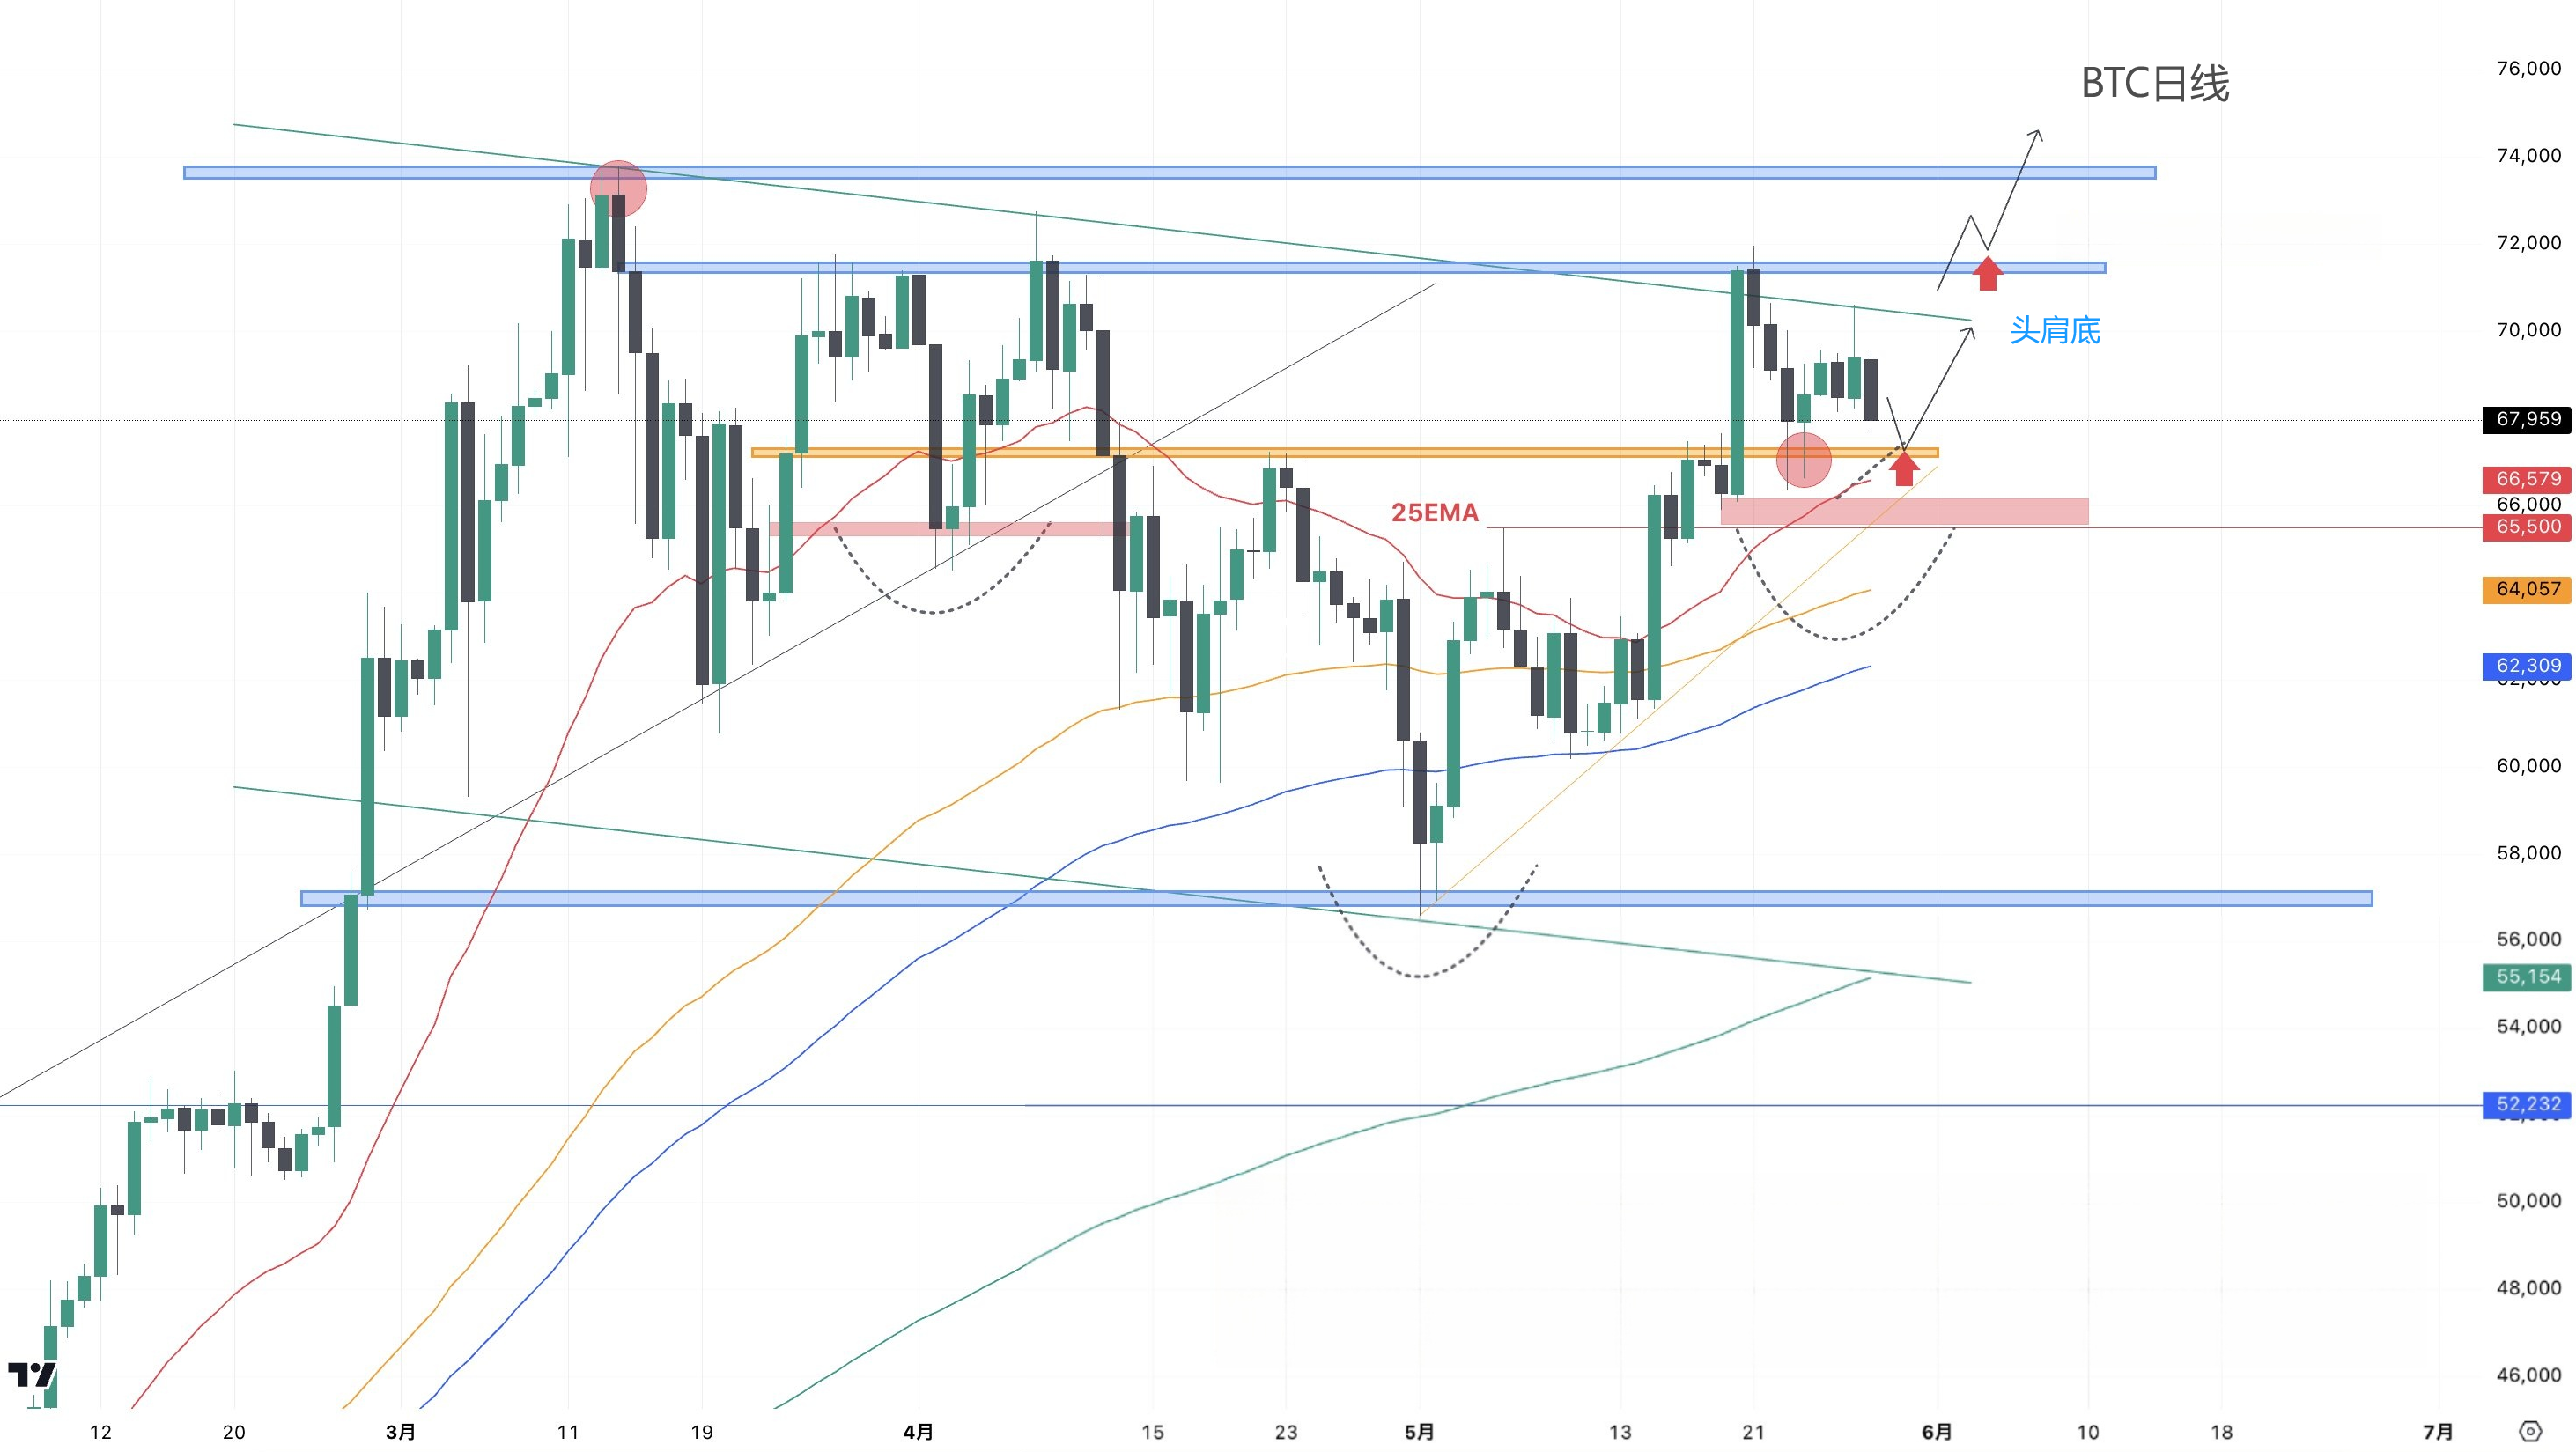
The daily chart still forms the right shoulder of a head and shoulders pattern, so Jinrui believes that the key lies in whether it can break through the neckline. After observing the left shoulder, it is possible to form a wider right shoulder, so the 25EMA and the top of the right shoulder (yellow area) on the daily chart are trading points worth paying attention to.
Therefore, it is still necessary to pay attention to whether a head and shoulders pattern is formed at the daily chart level. If BTC falls to the yellow area, it will also be a suitable time to buy again.
【BTC 4-Hour Chart】
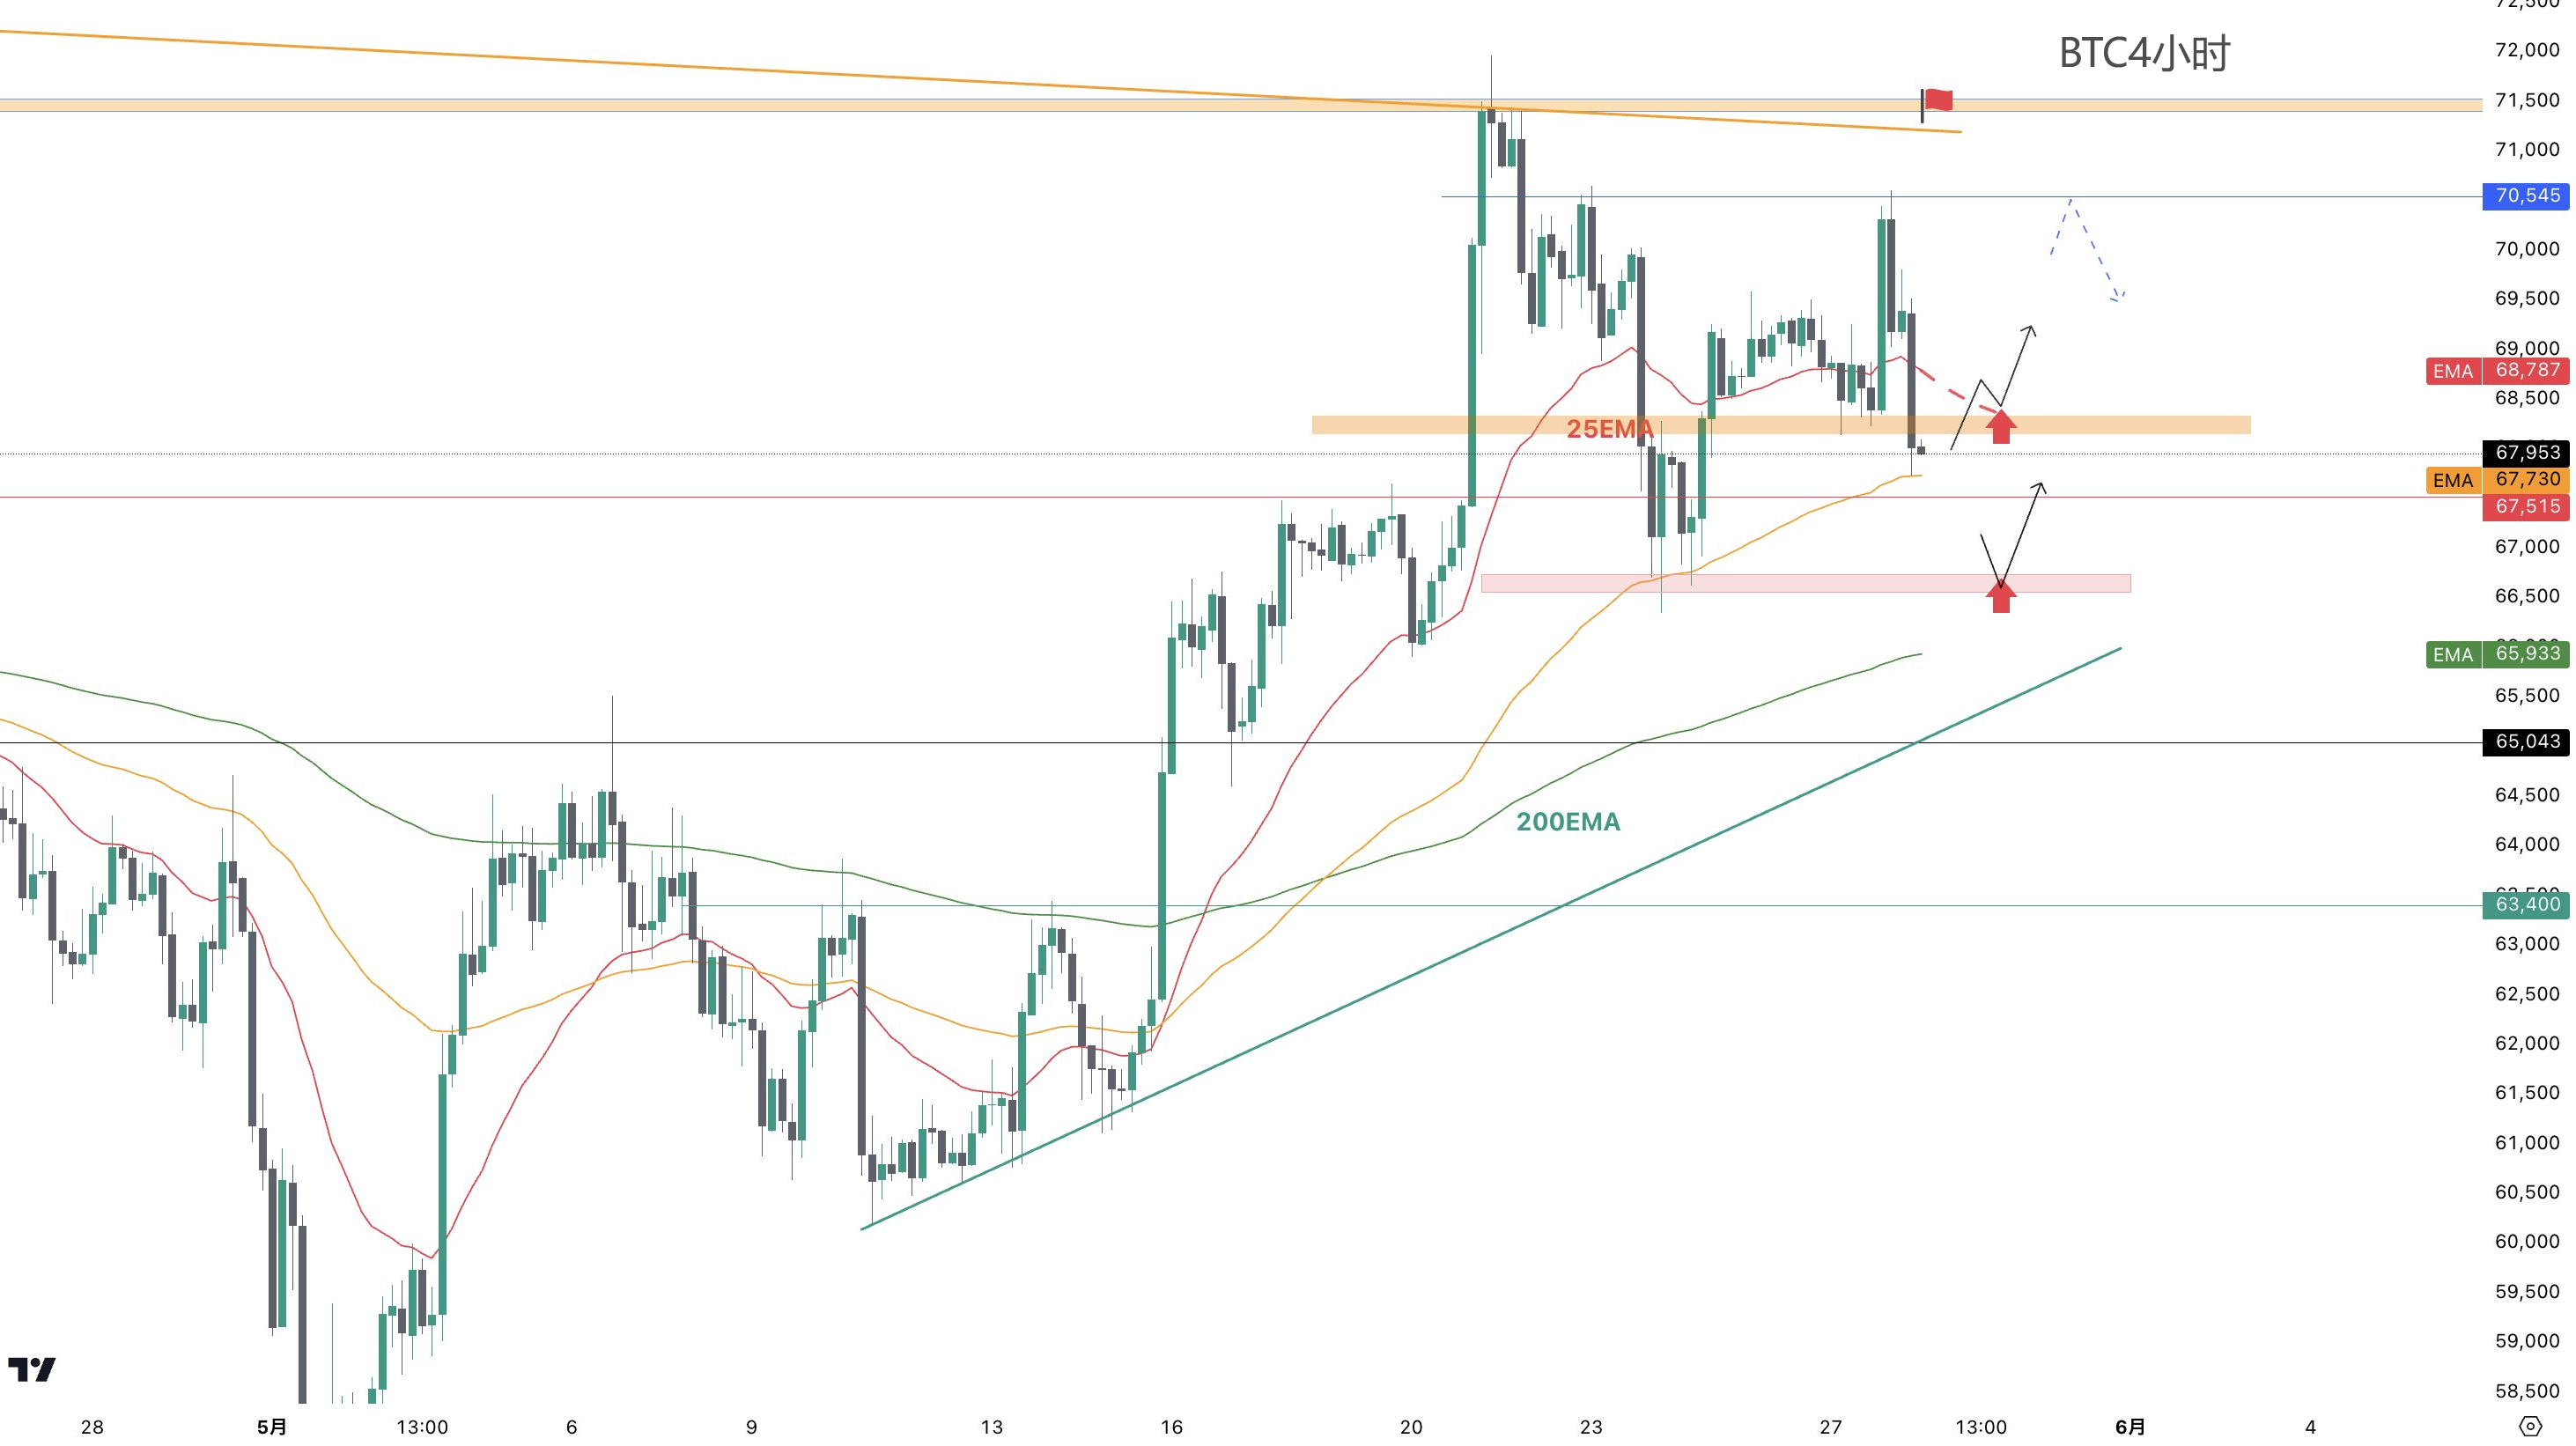
Currently, the 4-hour chart is in a stronger pullback than the uptrend. Jinrui believes that the key point of the breakthrough is whether it can maintain the support of the 4-hour 75EMA.
If a deep pullback occurs, it is expected to fall to near the low point of the 4-hour chart, at around $66,500.
〜Summary of Entry Points〜
Short after the price falls below 4H 75EMA ($67,750)
- Target: around $66,500
Long near $66,500
- Stop Loss: 4H 200EMA ($66,000), Target: around $67,600
The current market direction may feel very unclear to many friends. As shown in the daily chart, Jinrui believes that once the adjustment period ends, not only $70,000, but also a challenge to $80,000 is imminent.
If you want to receive real-time information later, please like & share to let me know 🙌🏻. If this is helpful to you, I hope you can like it ❤️ and follow me, looking forward to your support.
I have many years of in-depth research on spot contracts, BTC, ETH, and various altcoins. If you are not doing well in trading, experiencing long-term losses, or getting stuck in trades, you can follow my public account (AICoin Jinrui). Investment involves risks, so be cautious when entering the market. The daily market situation is full of twists and turns, and all I can do is to use my years of practical experience to help everyone make the right investment decisions and manage their operations in the right direction.

The end of the article and other advertisements in the comments section are not related to me personally!! Please be cautious in distinguishing between true and false, thank you for reading.
免责声明:本文章仅代表作者个人观点,不代表本平台的立场和观点。本文章仅供信息分享,不构成对任何人的任何投资建议。用户与作者之间的任何争议,与本平台无关。如网页中刊载的文章或图片涉及侵权,请提供相关的权利证明和身份证明发送邮件到support@aicoin.com,本平台相关工作人员将会进行核查。


