5/26/Community: Identification and Practical Skills for True and False Breakthroughs The live broadcast will share various mainstream technical indicator application methods and analyze the technical forms of the day.


[BCH/4H Chart] Example
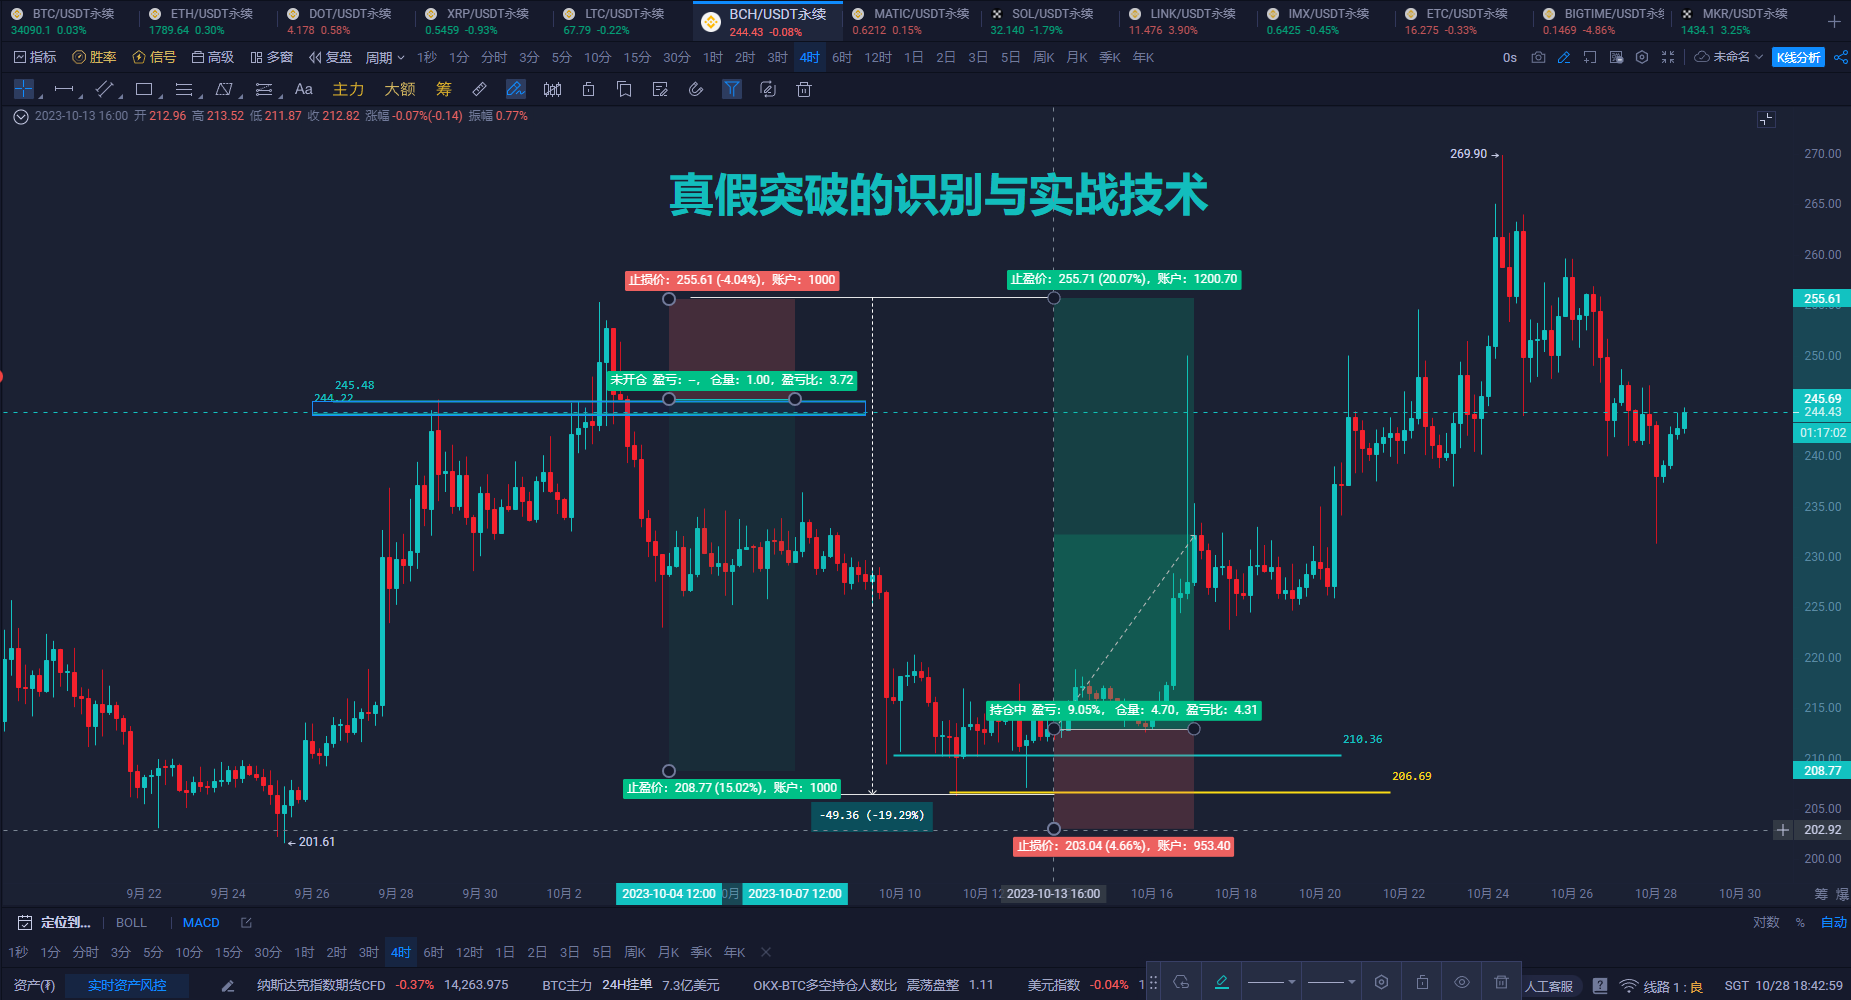
Identification and Practical Skills for True and False Breakthroughs; During the process of technical analysis and practical trading, the market often experiences many breakthroughs of support and resistance before continuing to develop in the breakthrough direction. However, various false breakthroughs in the actual trading process often lead to losses for partners who like to focus on breakthrough trading opportunities. How to skillfully use false breakthroughs for positive trading in the actual trading process is the main theme of today's article.
We will use the BCH 4-hour level for case analysis; on October 2nd, the resistance of BCH price was at 245. This resistance experienced three consecutive multi-pin topping bearish signals, followed by a brief strong breakthrough, reaching the highest point of 255, and then a 12-hour struggle for dominance between bulls and bears, ultimately being suppressed back below the 245 resistance. Two bearish trends then appeared, with the largest amplitude reaching about 20%. How to identify whether the market at that time was a false breakthrough requires the application of two knowledge points: first, clearly defining the resistance; second, whether there are classic bearish signals near the resistance area. BCH near the resistance repeatedly experienced three consecutive multi-pin topping bearish signals, lasting 12 hours. After a brief breakthrough, it could not effectively stay above the resistance and again took 12 hours for three bearish signals to return below the resistance. The shooting star line at the time of the high and low retreat was the best entry point for short positions, with the stop loss set above 255. The subsequent market trend is then a question of capturing the bearish gains for one or two segments. Therefore, false breakthroughs in technical trading are actually a very good trading opportunity, worthy of in-depth study by partners!

Recommended Approach [No Opinion] Support/Resistance Tencent Meeting ID: 565-877-8060 Seven live broadcasts daily: 14:00-21:30 uninterrupted

**[Liejinshe] Elite Class - What Can You Get?
- Get midday videos at the first time//2. Get market intraday views at the first time**
3. Get short, medium, and long-term strategies at the first time//4. Full tracking and guidance on strategies
**5. Have the opportunity to participate in exclusive midnight battles//6. Have the opportunity to participate in million-level courses
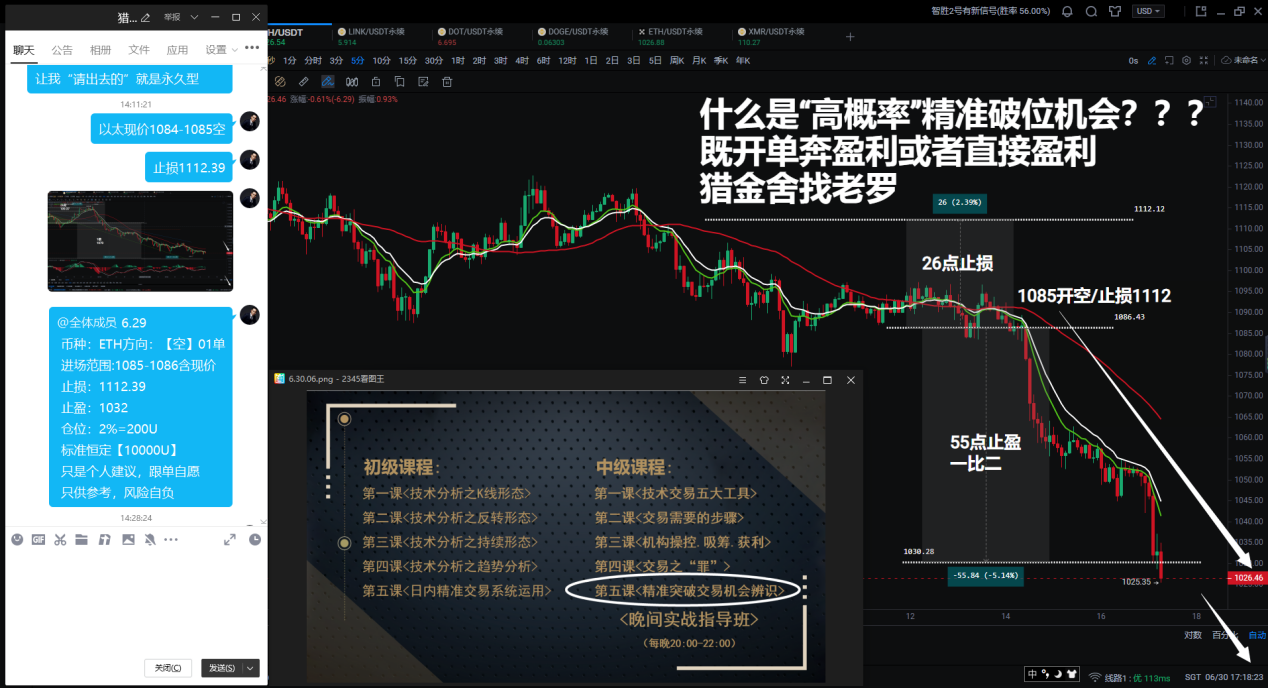
**[Efficient. Accurate. Capturing Breakthrough Trading Opportunities]

2023 Full-Year Strategy Guidance RecordJanuary-December 2023///9 wins 3 losses January complete/return rate 2322%///February complete/return rate -475%
March complete/return rate 3126%///April complete/return rate -491% May complete/return rate +560%///June complete/return rate -66% July complete/return rate +680%///August complete/return rate +82.54% September complete/return rate 1346%///October complete/return rate 1298% November complete/return rate 1752%///December complete/return rate 1384% January-December 2023 complete total 12650% Single margin 300U calculation*12650%=37950U 2022 Full-Year Strategy Guidance RecordFebruary-December 2022///10 wins 1 loss February complete/return rate 2500%///March complete/return rate 2500%
April complete/return rate 2626%///May complete/return rate 3698% June complete/return rate 3081%///July complete/return rate 7033% August complete/return rate 4694%///September complete/return rate 5046% October complete/return rate 1438%///November complete/return rate 2362% December complete/return rate -474%/// February-December 2022 complete total 34504% Single margin 100U calculation*34504%=34504U Each strategy//has evidence and can be traced back to the start time, year, month, day, hour, minute, and second, with graphic and textual records. Interested parties can scan the code to join the group for verification!!


(Scan to follow the official account and experience more services)
免责声明:本文章仅代表作者个人观点,不代表本平台的立场和观点。本文章仅供信息分享,不构成对任何人的任何投资建议。用户与作者之间的任何争议,与本平台无关。如网页中刊载的文章或图片涉及侵权,请提供相关的权利证明和身份证明发送邮件到support@aicoin.com,本平台相关工作人员将会进行核查。