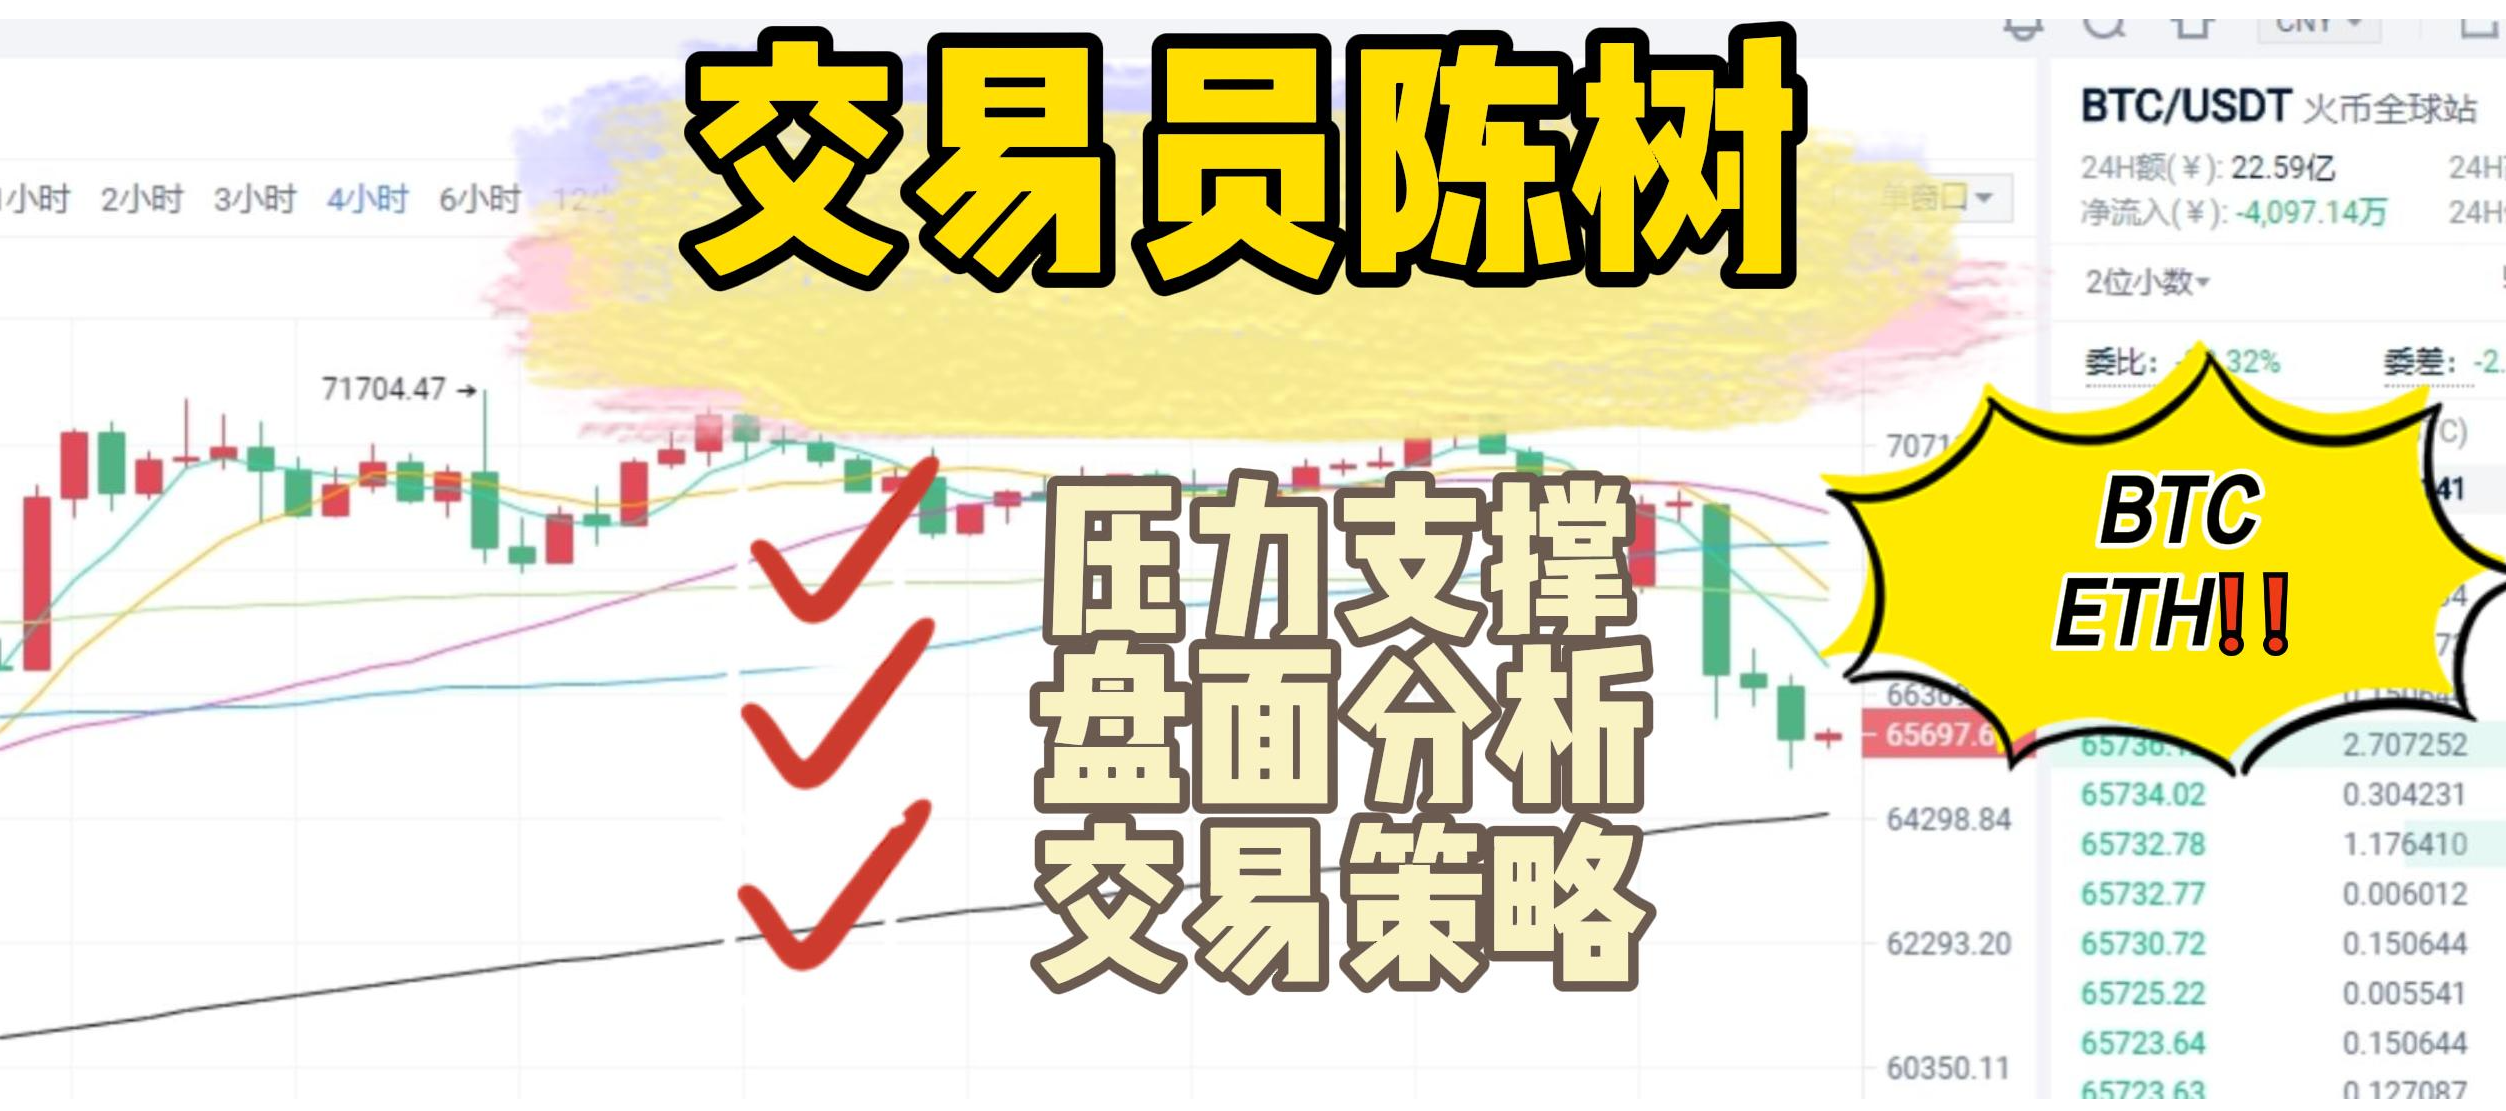
5/19/Community: Capturing Long and Short Opportunities After the Cross of Three Moving Averages… Topic: Various Correct Applications of Moving Averages and Candlestick Charts Live broadcast sharing various mainstream technical indicator application methods, as well as technical analysis of the day's technical forms;


【BCH 4/1H Chart】Example
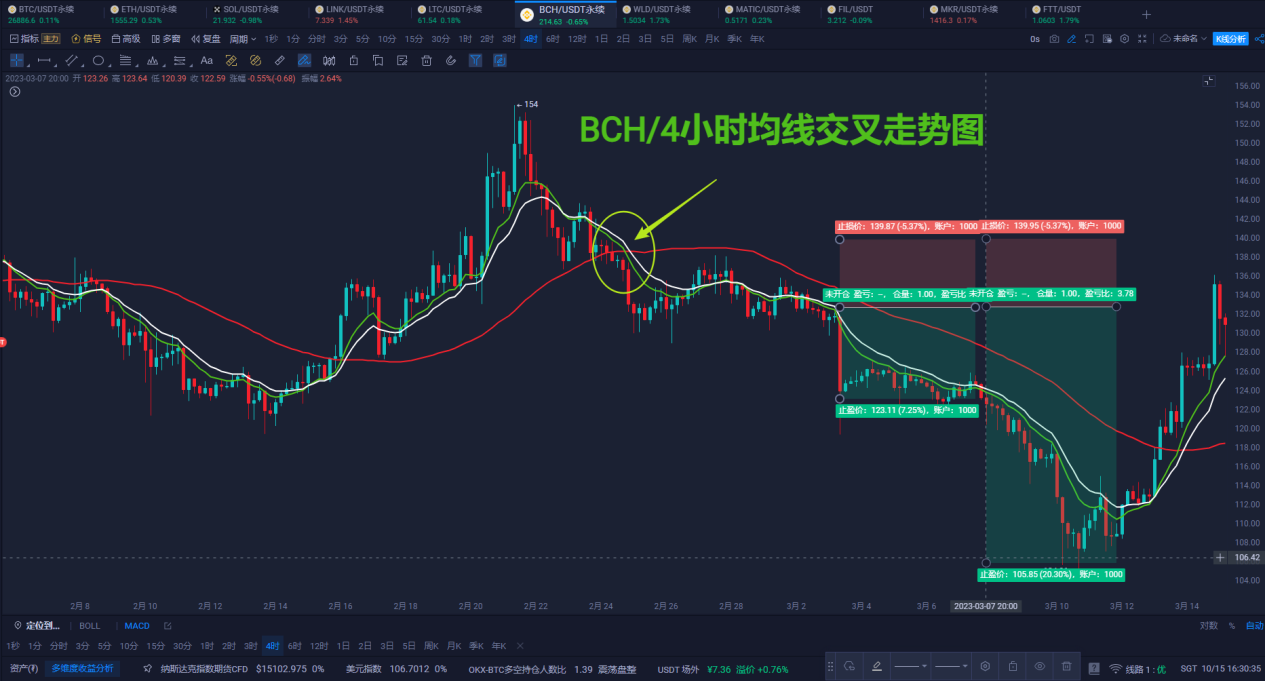
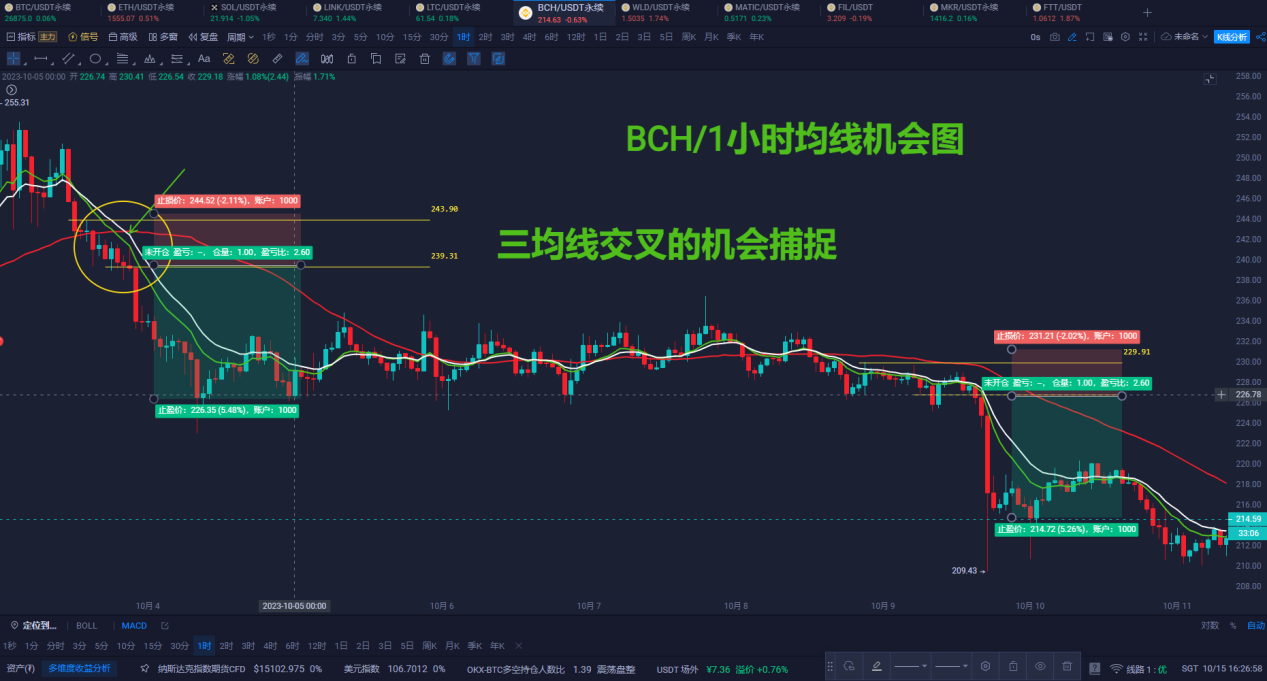
Three Moving Average Parameter Settings: 50MA/15EMA/10EMA/ Understanding: EMA crossing below 50MA is a death cross, indicating the start of seeking bearish signals and combinations for shorting; EMA crossing above 50MA is a golden cross, indicating the start of seeking bullish signals and combination structures; Practical case analysis: The BCH 4-hour price trend chart fell from the highest price of 154 to below 140 on February 24; the death cross of the three moving averages was officially established; and then the price consolidated below the death cross of the three moving averages for several days and rebounded several times, but was resisted below the 50MA, showing many bearish forms such as double pin tops, dark cloud cover, and bearish engulfing, eventually continuing two major bearish trends; the first trend fell by about 8%, and the second trend fell by about 20% in total; BCH 1-hour price trend chart; after 8 pm on October 3, the price fell from the highest point of 255 to below 240, and the death cross of the three moving averages was officially established; after a slight adjustment, there were two consecutive bearish trends with a drop of about 5%; all of the above are successful cases; how to find the correct long and short trading opportunities in the face of unknown market conditions will be explained in detail for everyone at 8 pm tonight!
【ETH/4H Chart Contract Market Long and Short Data; Updated at 12:00 PM Daily】
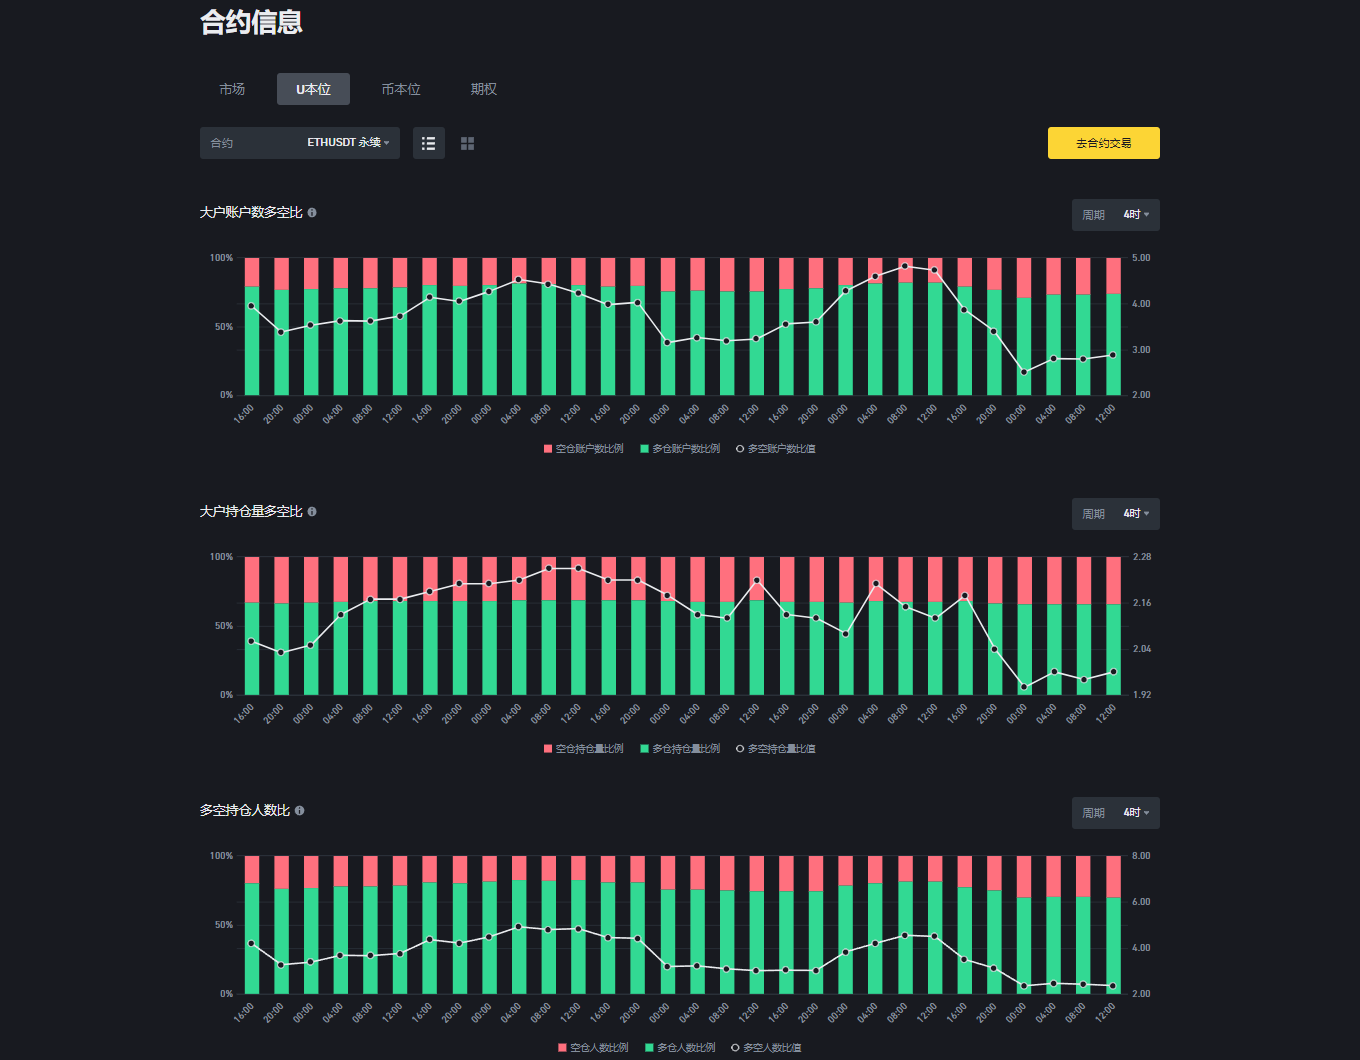
**ETH 4-hour contract long and short data tracking:
- Large account long/short ratio: Short position holding ratio: 25.78%; Long position holding ratio: 74.22%;
Long/short position volume ratio: 2.88 - Large account position volume long/short ratio: Short position holding ratio: 33.57%; Long position holding ratio: 66.43%;
Long/short position volume ratio: 1.98 - Long/short position volume person ratio: Short position person ratio: 29.73%; Long position person ratio: 70.27%
Long/short position person ratio: 2.36
More details are welcome to be discussed and learned in the live broadcast room!**

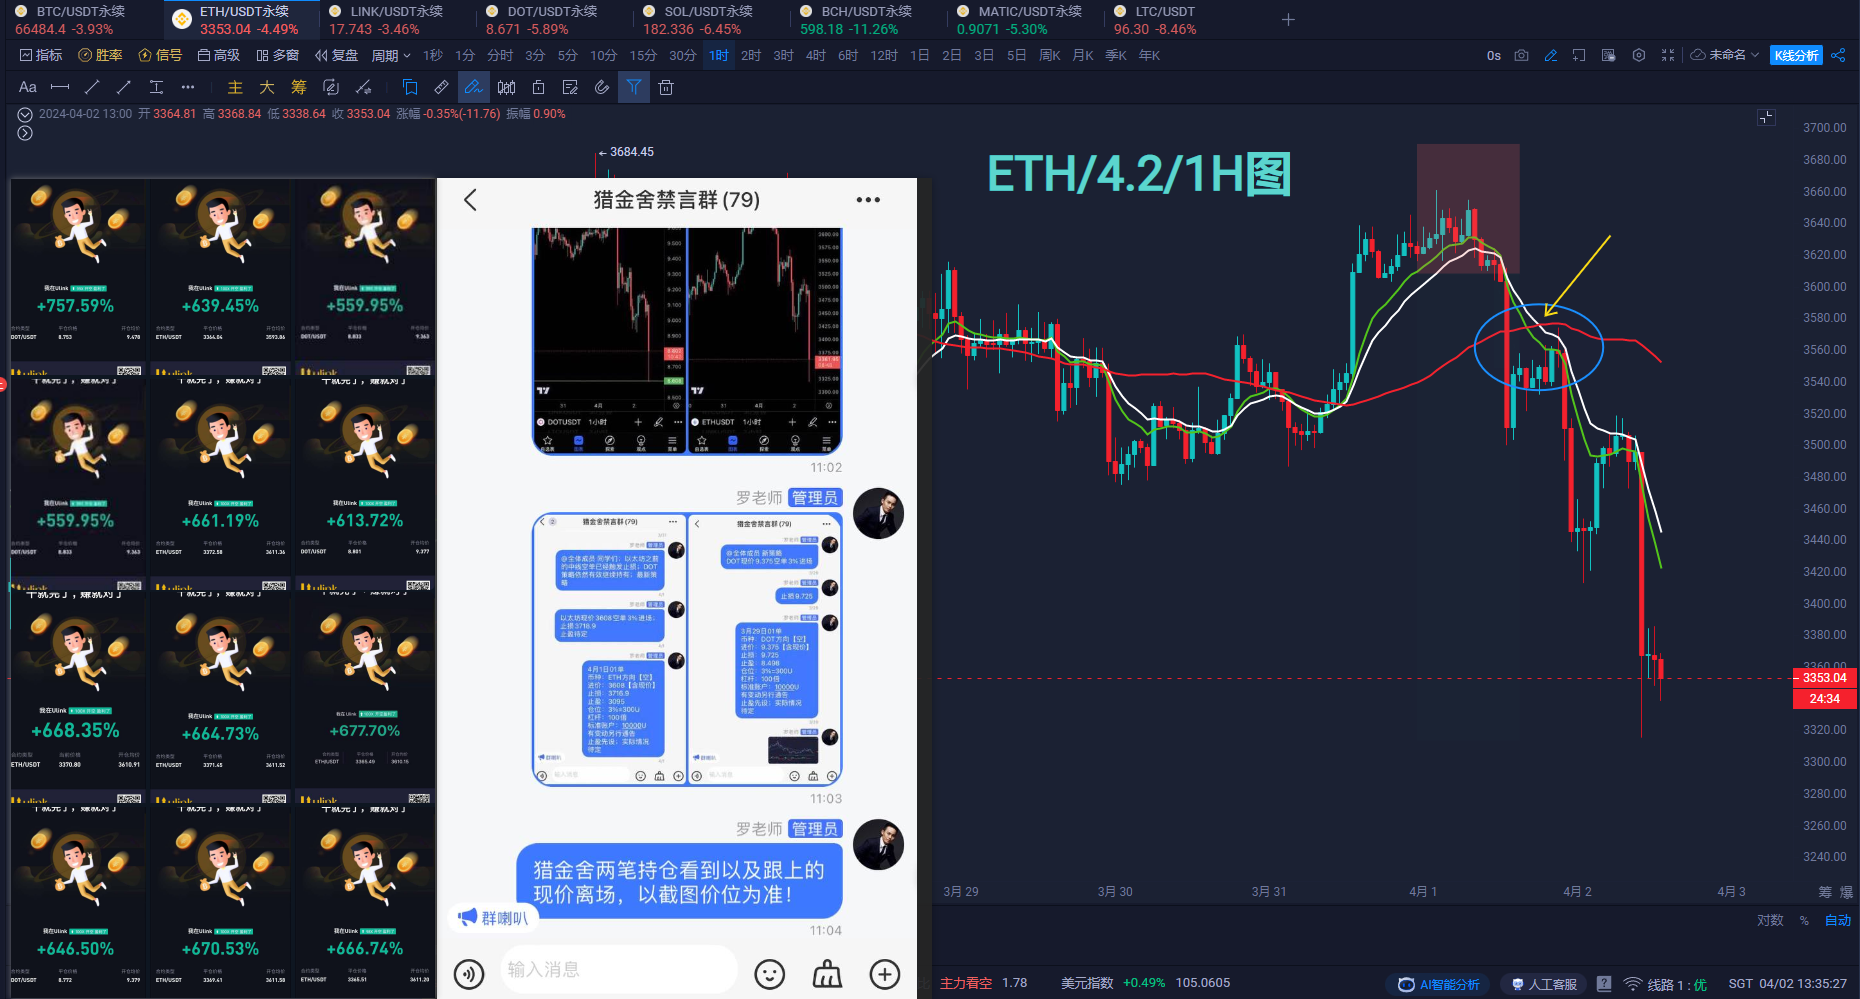
Recommended Approach [Strong Daily K]: Support 3050-320/Resistance 3120-3150 Tencent Meeting ID: 565-877-8060 Five live broadcasts daily from 14:00 to 21:30 uninterrupted

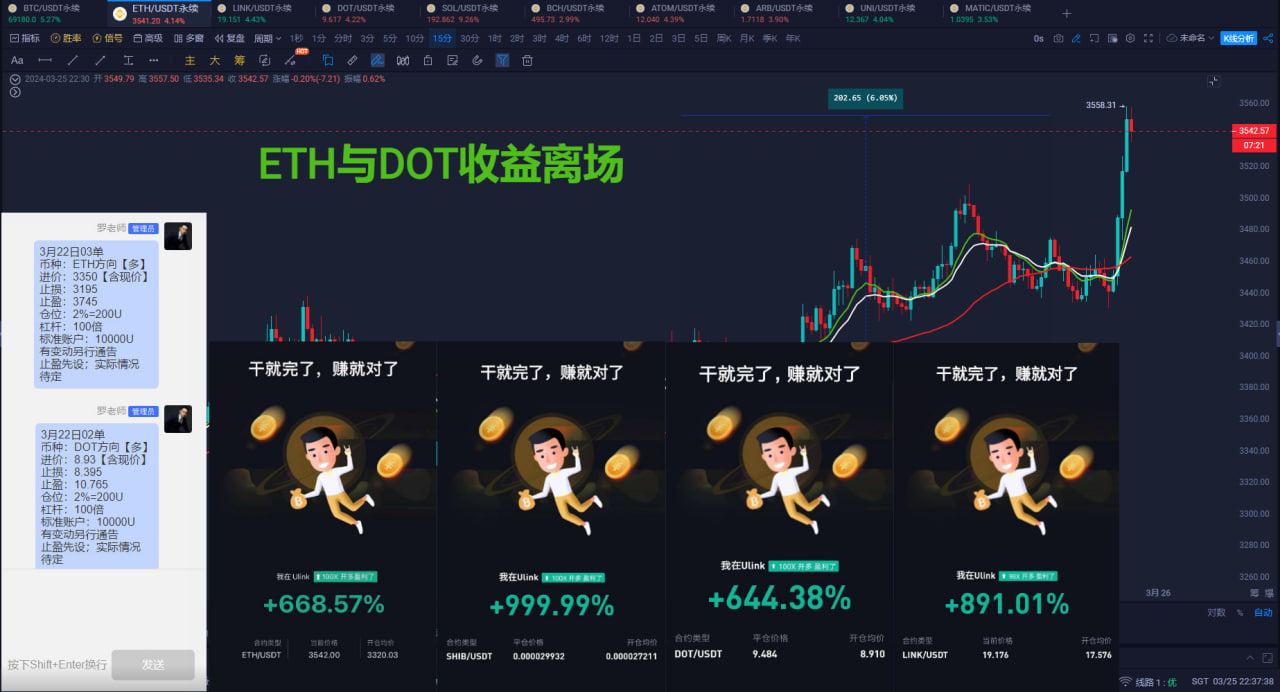
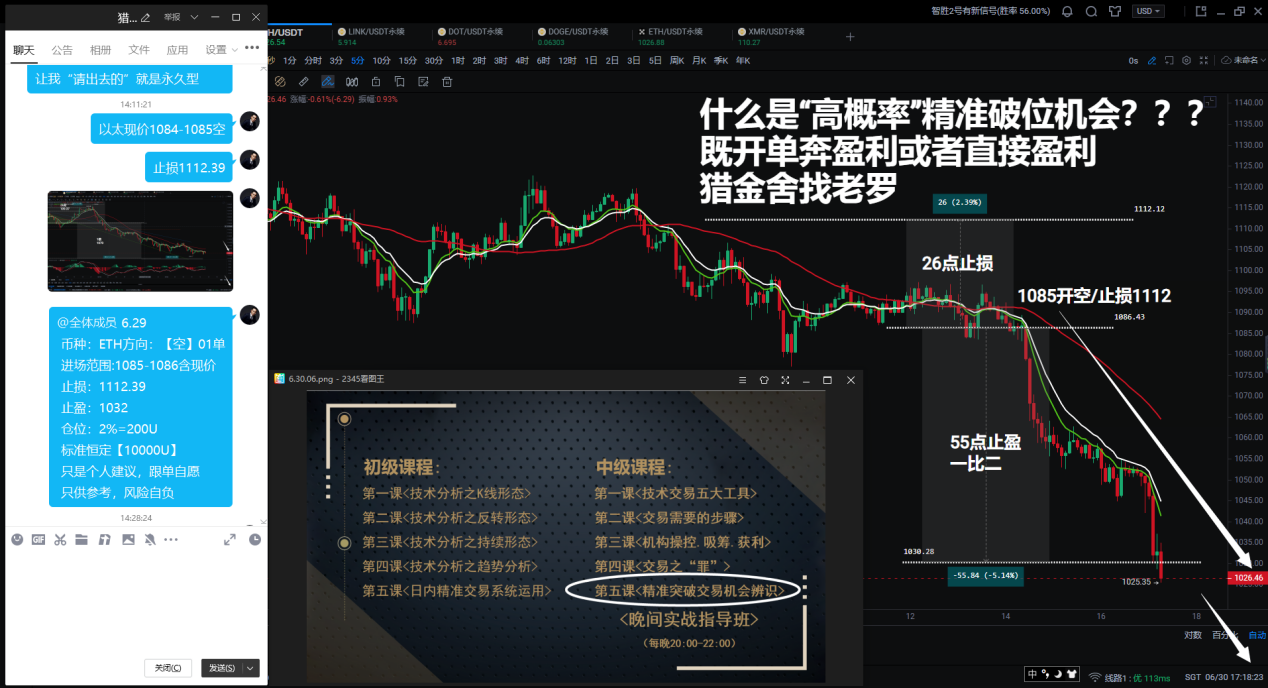
ETH/DOT Short Strategy Tracking Conclusion: Comprehensive returns are between 1200% and 1400%
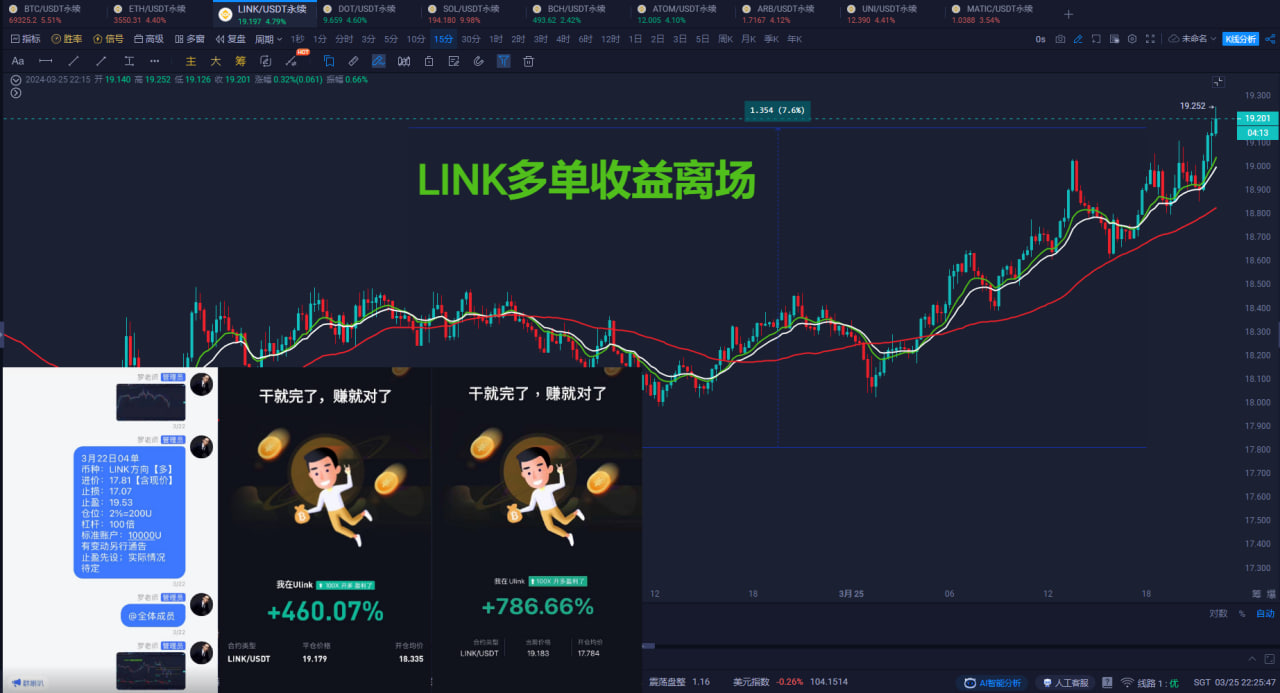
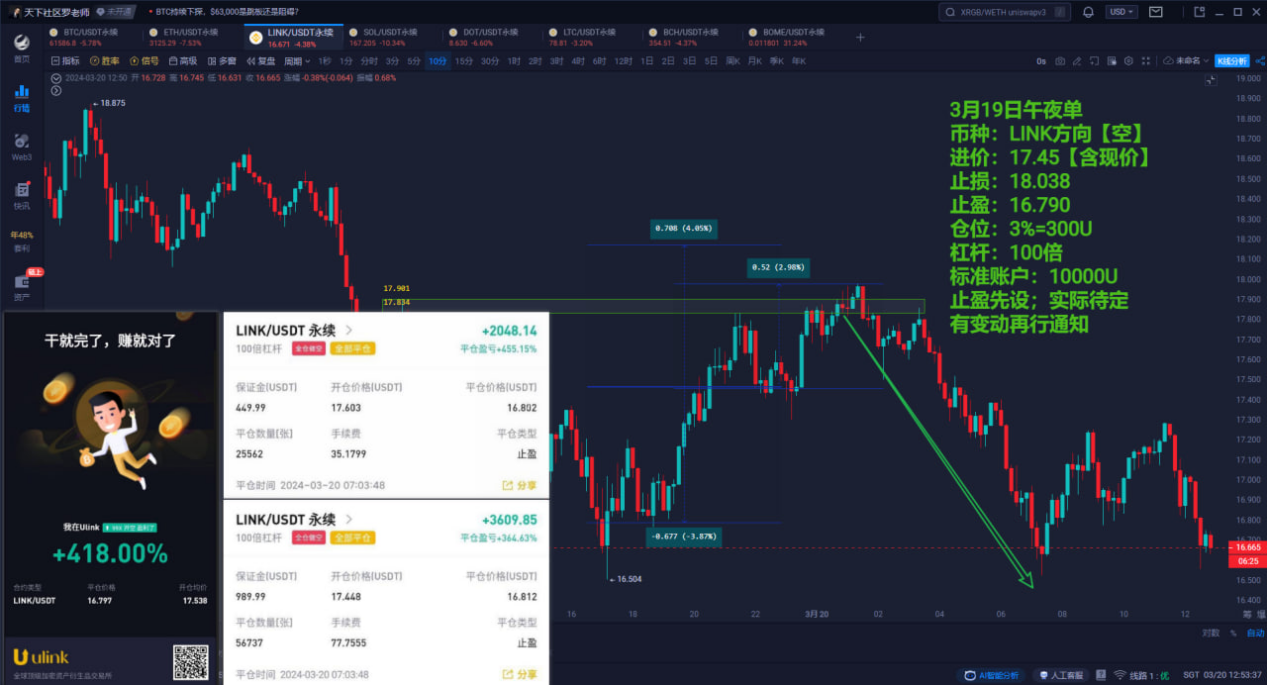
LINK/4H Strategy Tracking Conclusion: On March 22-23, the expected 4-hour head and shoulders pattern and the first and second bullish targets of 19.5-20 were perfectly reached, with the highest price reaching 20.765; for partners who have taken this strategy seriously and tracked it, the returns should be between 600% and 1000%; we will continue to track the next long and short opportunities for LINK!
**[Hunt for Gold] What can you get from the elite class???
- Get the midday video at the first time//2. Get market intraday views at the first time**
3. Get short, medium, and long-term strategies at the first time//4. Track and guide the strategy throughout
**5. Have the opportunity to participate in the exclusive midnight battle//6. Have the opportunity to participate in million-level courses
****[Efficient. Accurate. Capturing Breakthrough Trading Opportunities]
**

2023 Full-Year Strategy Guidance RecordJanuary-December 2023///9 wins 3 losses January complete/return rate 2322%///February complete/return rate -475%
March complete/return rate 3126%///April complete/return rate -491% May complete/return rate +560%///June complete/return rate -66% July complete/return rate +680%///August complete/return rate +82.54% September complete/return rate 1346%///October complete/return rate 1298% November complete/return rate 1752%///December complete/return rate 1384% January-December 2023 complete total 12650% Single margin 300U calculation*12650%=37950U 2022 Full-Year Strategy Guidance RecordFebruary-December 2022///10 wins 1 loss February complete/return rate 2500%///March complete/return rate 2500%
April complete/return rate 2626%///May complete/return rate 3698% June complete/return rate 3081%///July complete/return rate 7033% August complete/return rate 4694%///September complete/return rate 5046% October complete/return rate 1438%///November complete/return rate 2362% December complete/return rate -474%/// February-December 2022 complete total 34504% Single margin 100U calculation*34504%=34504U Each strategy//has evidence and traces, traceable to the start time to the year, month, day, hour, minute, and second, with graphic and textual records/interested parties scan the code to join the group for certification !!


(Scan the code to follow the official account and experience more services)
免责声明:本文章仅代表作者个人观点,不代表本平台的立场和观点。本文章仅供信息分享,不构成对任何人的任何投资建议。用户与作者之间的任何争议,与本平台无关。如网页中刊载的文章或图片涉及侵权,请提供相关的权利证明和身份证明发送邮件到support@aicoin.com,本平台相关工作人员将会进行核查。