On the evening of May 16th, AICoin's editor shared the analysis techniques for the main force's password, achieving 9 wins and 1 draw in the live broadcast room.
To obtain the main force's password: https://www.aicoin.com/vip/chartpro
Key points of the live broadcast - Techniques for a 90% win rate with the main force's password:
Technique 1: The longer the hanging time of an order, the more reference significance it has, and it is very likely that the price will reach the target set by the main force.
Technique 2: Combine macro data, especially data that can affect interest rate hikes or cuts in the United States.
Technique 3: During a period of sideways oscillation, pull the statistics of the main force's large orders, compare which side has more buy orders, and which side has more sell orders. More buy orders indicate a bullish trend, while more sell orders indicate a bearish trend.
I. Technique Sharing
The main force's password is a comprehensive analysis by AICoin's editor, combining the indicator of 【Main Force Large Order Statistics】, macroeconomic data, and other factors to interpret whether the main force is bullish or bearish.
The main force's password can be viewed in the "Flash News - Main Force" section on the APP and PC platforms.
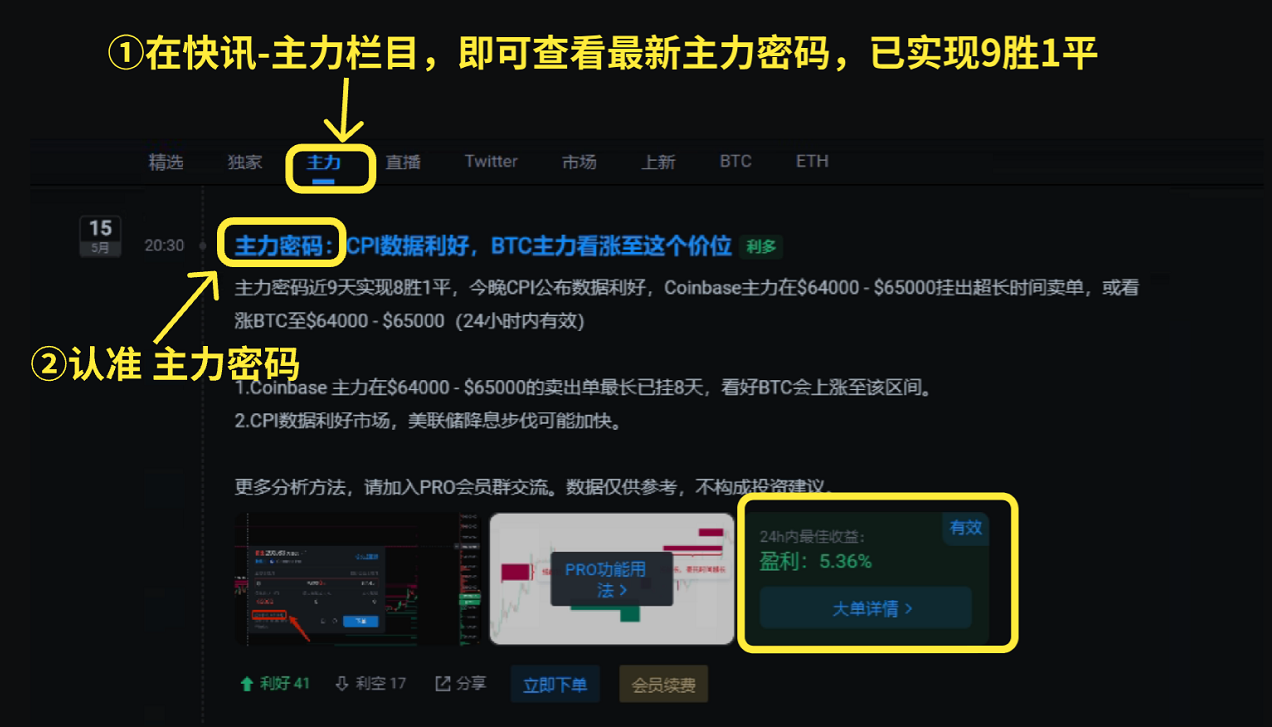
On the evening of the 15th, BTC surged past the $66,000 mark, and the main force's password accurately predicted a bullish trend, resulting in over 5% profit.
The reasons for the bullish trend are as follows:
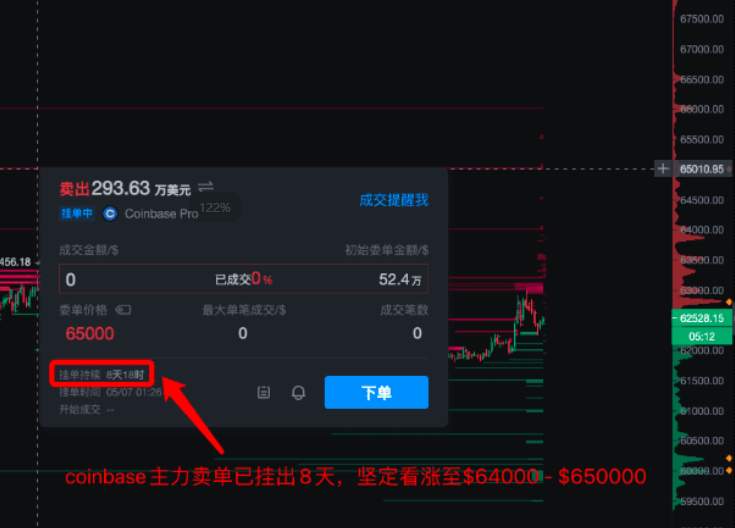
The sell orders by Coinbase in the $64,000-$65,000 range have been hanging for 8 days, indicating confidence in BTC's rise to that range.
The CPI data is favorable for the market, and the pace of interest rate cuts by the Federal Reserve may accelerate.
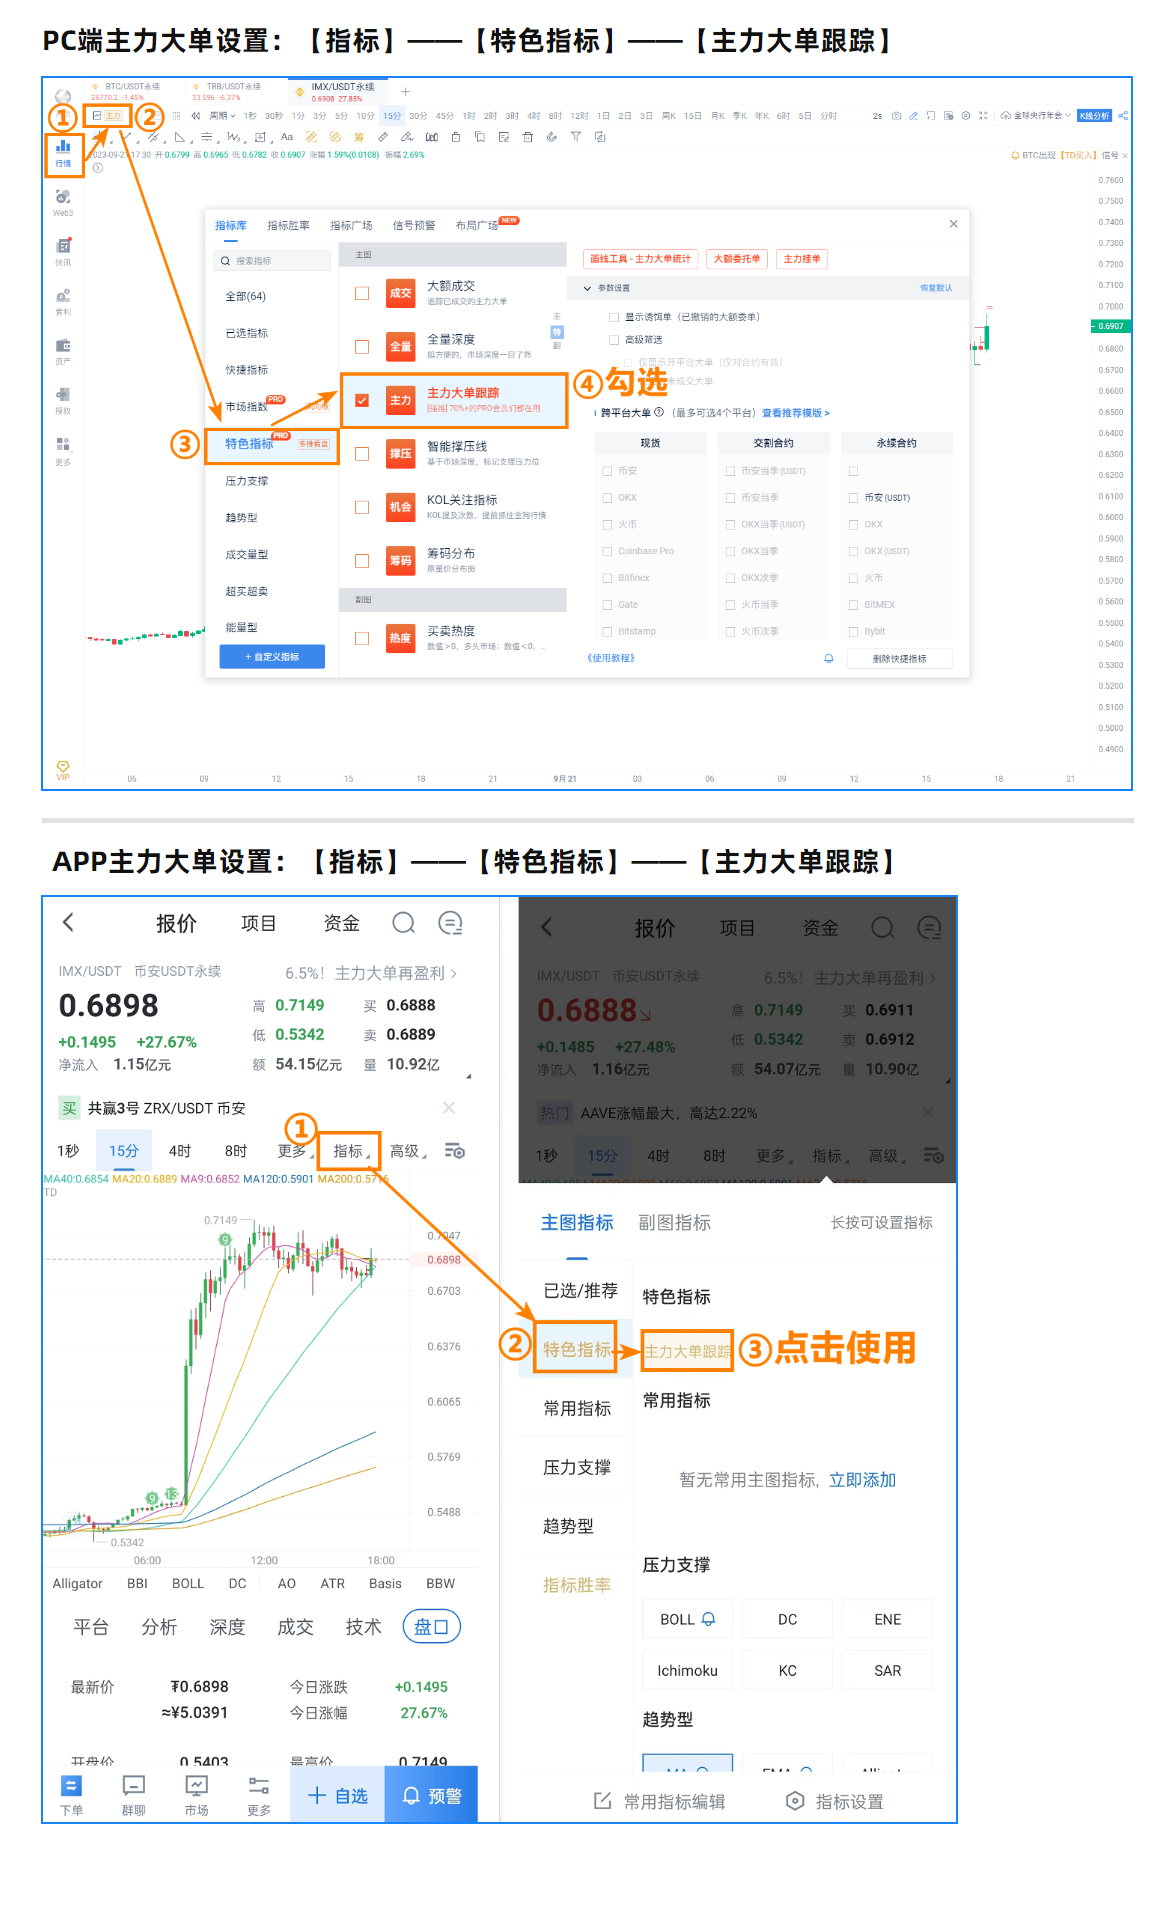
On the APP and PC platforms, open the main force's large order statistics in the K-line section to view the hanging order situation of the main force.
The hanging order situation on the 15th is shown in the image below:
Emphasizing the 90% win rate technique:
Technique 1: The longer the hanging time of an order, the more reference significance it has, and it is very likely that the price will reach the target set by the main force.
Both buy and sell orders are hanging, leading to technique 2, which requires combining more data.
Technique 2: Combine macro data, especially data that can affect interest rate hikes or cuts in the United States.
At 20:30 on the 15th, the CPI data released by the United States was favorable, combined with the main force's long hanging orders, making it easy to judge that the main force is bullish.
It's important to note that idle funds also have costs, and if borrowed, the cost is even higher. Even if not borrowed, investing the funds elsewhere would yield returns, hence the price reaching this level due to the long hanging time.
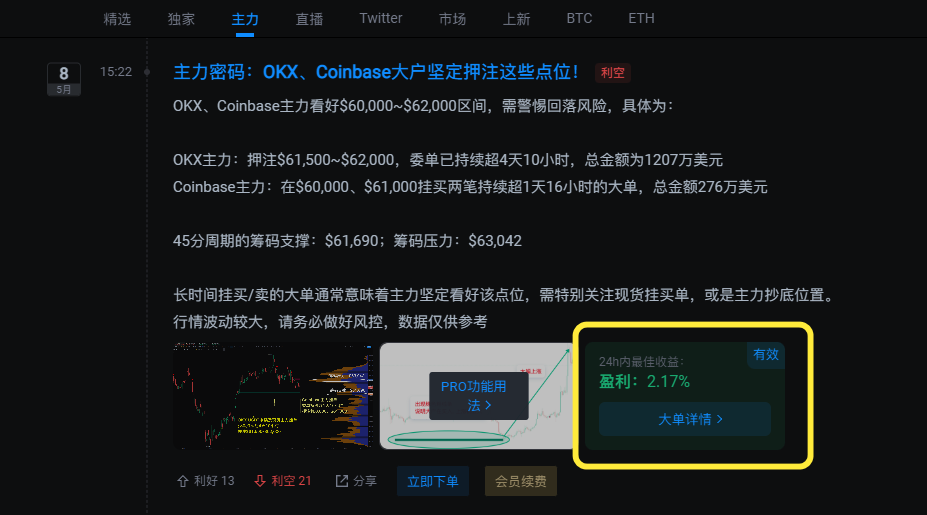
Technique 1 also has an extension, where if there are many orders hanging in a certain range for a relatively long time, the price is very likely to reach that range, as shown in the following examples.
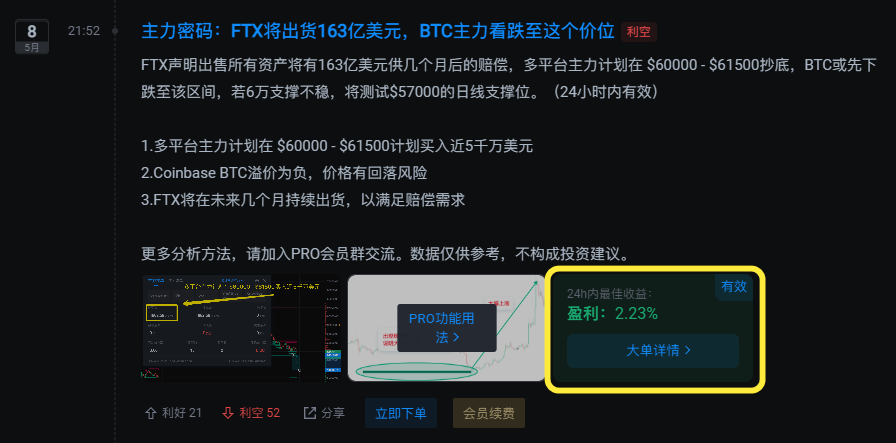
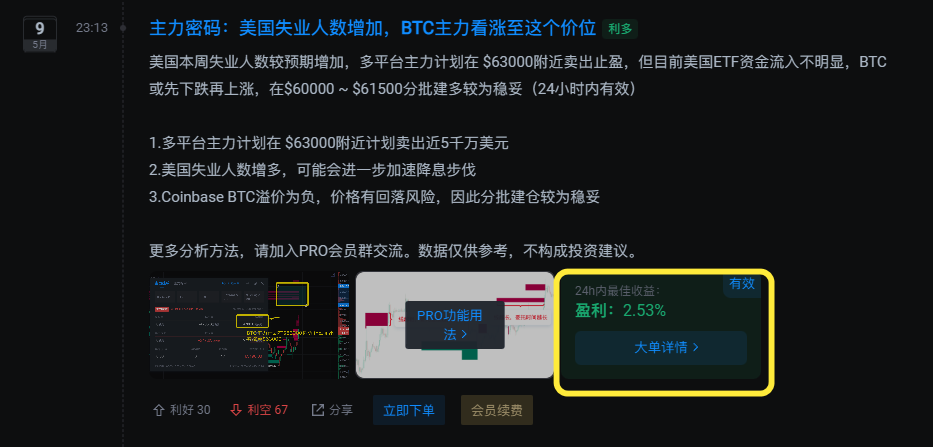
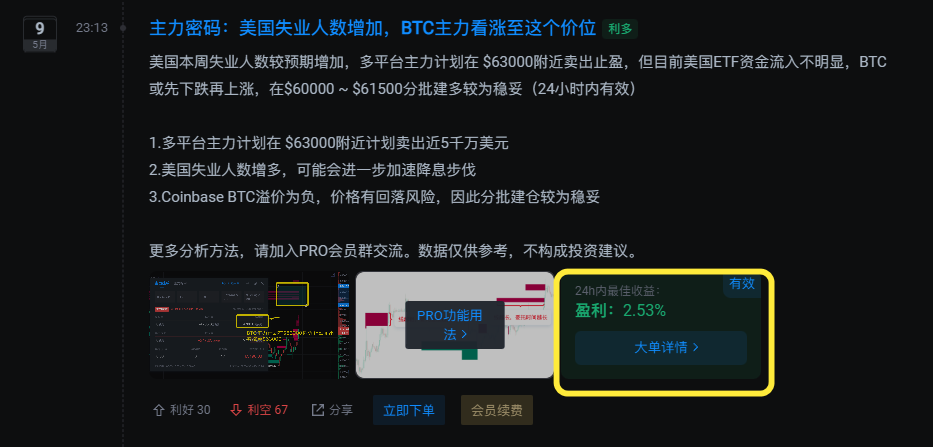
On the evening of the 16th, there was also influential data - unemployment benefits, and last week, it was unemployment benefits + main force's large orders, and BTC rose to $63,000 as expected.

To achieve 9 wins and 1 draw, there is also Technique 3: During a period of sideways oscillation, pull the statistics of the main force's large orders, compare which side has more buy orders, and which side has more sell orders. More buy orders indicate a bullish trend, while more sell orders indicate a bearish trend. For example, during the sideways movement from the 10th to the 12th, there were significantly more buy orders by the main force.
Returning to Technique 3, use the Main Force Large Order Statistics tool to pull the statistics during the oscillation period.
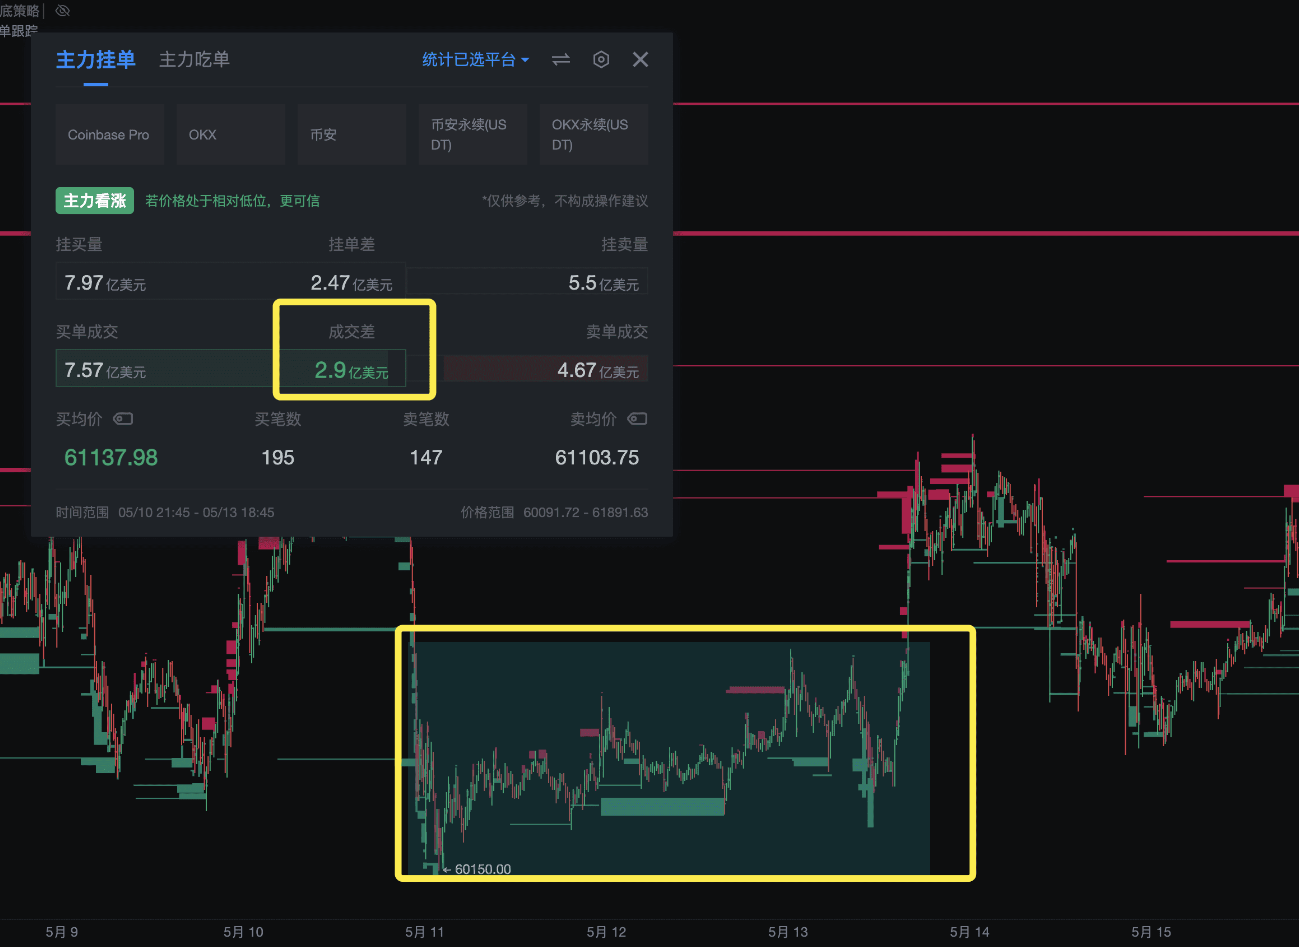
During the oscillation period, there were significantly more buy orders than sell orders, and subsequently, the price rose. During an oscillation period, energy is generally accumulated, and the longer the oscillation, the more obvious the comparison by the main force, leading to more accurate predictions.
II. Market Analysis
1. ETH Analysis
Before the surge, during the oscillation period of Ethereum, Technique 3 can be applied, with more buy orders, leading to a subsequent rise.
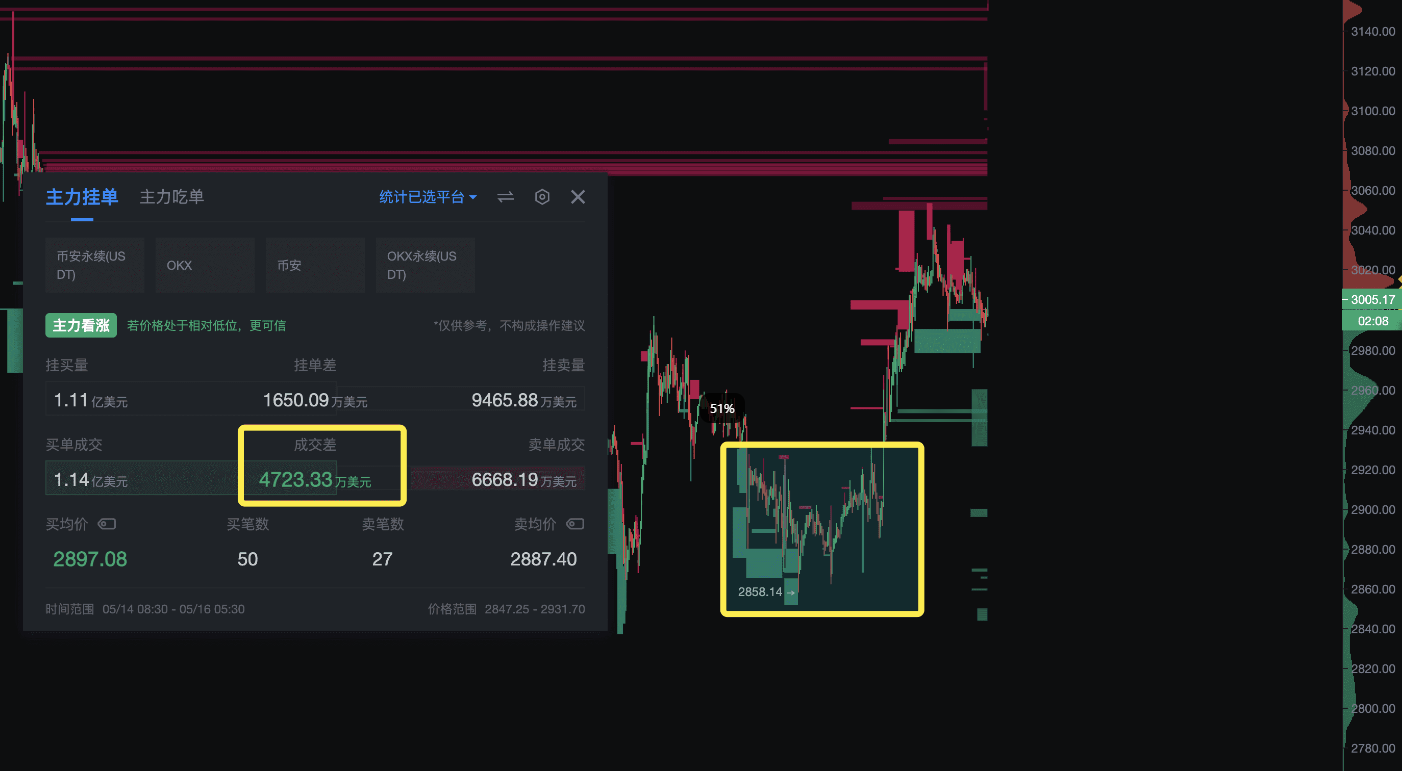
The weakness of Ethereum is due to:
1) The continuous promotion of spot ETFs.
2) Also, the Constantinople upgrade is actually bearish for Ethereum, as it reduces Ethereum's consumption and inflation rises.
2. BTC Analysis
The hanging orders for BTC are as follows:
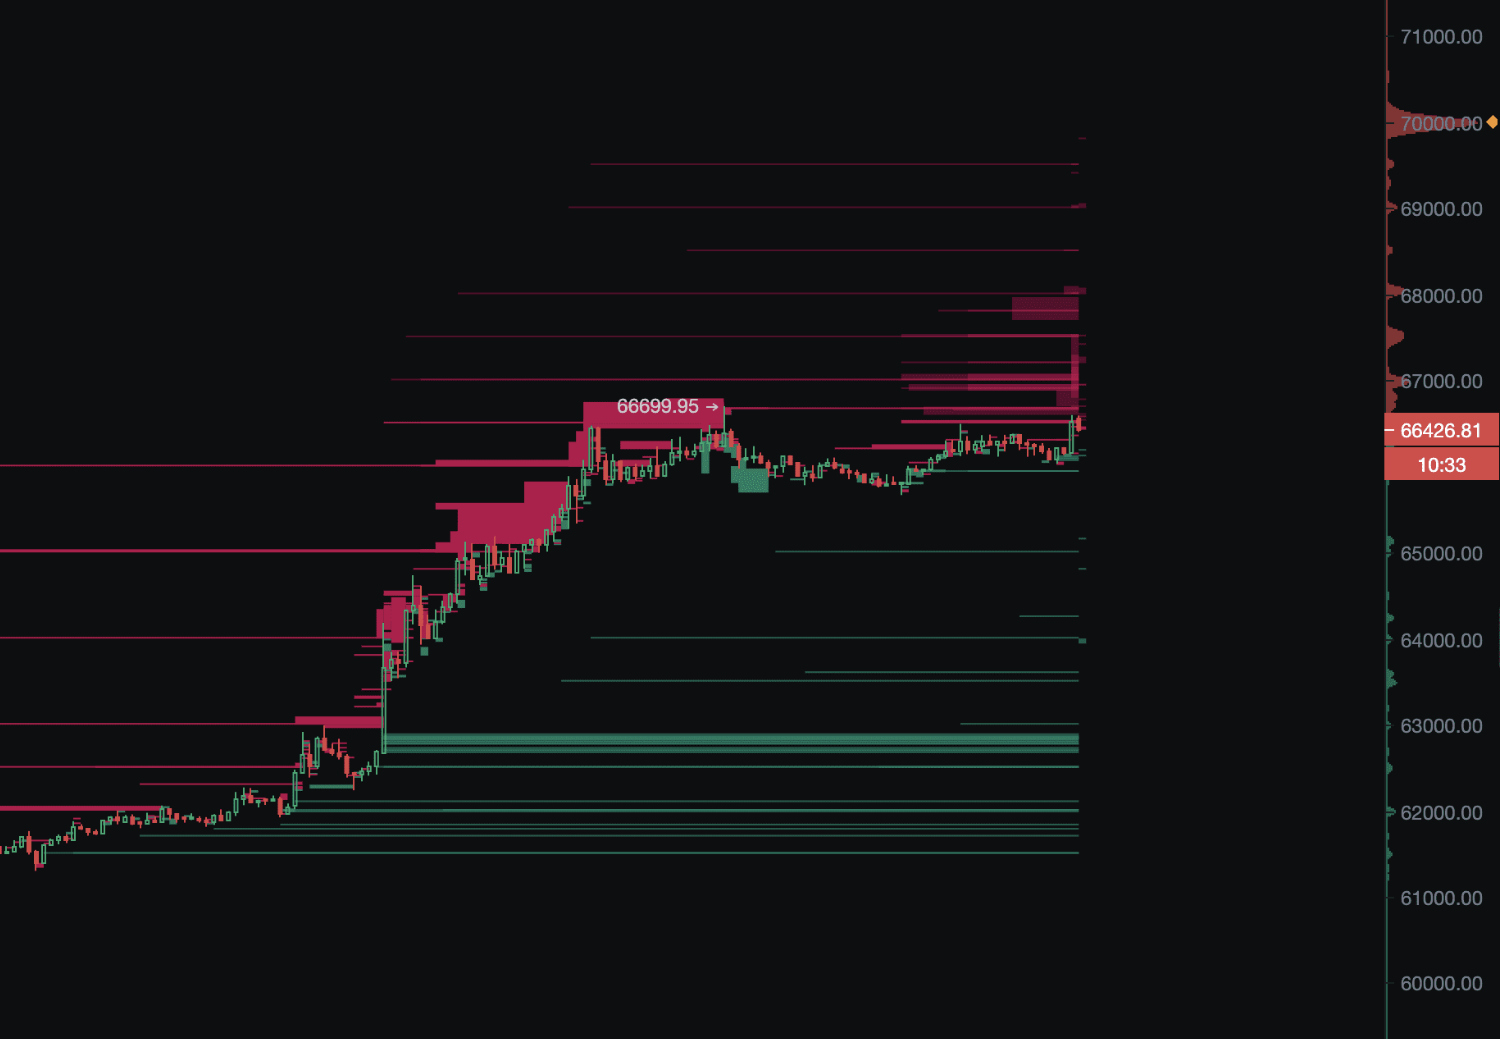
There are densely placed buy orders at the bottom, but none have exceeded 2 days, so they are not particularly long. Some of the main force wants to buy BTC at this range if it falls.
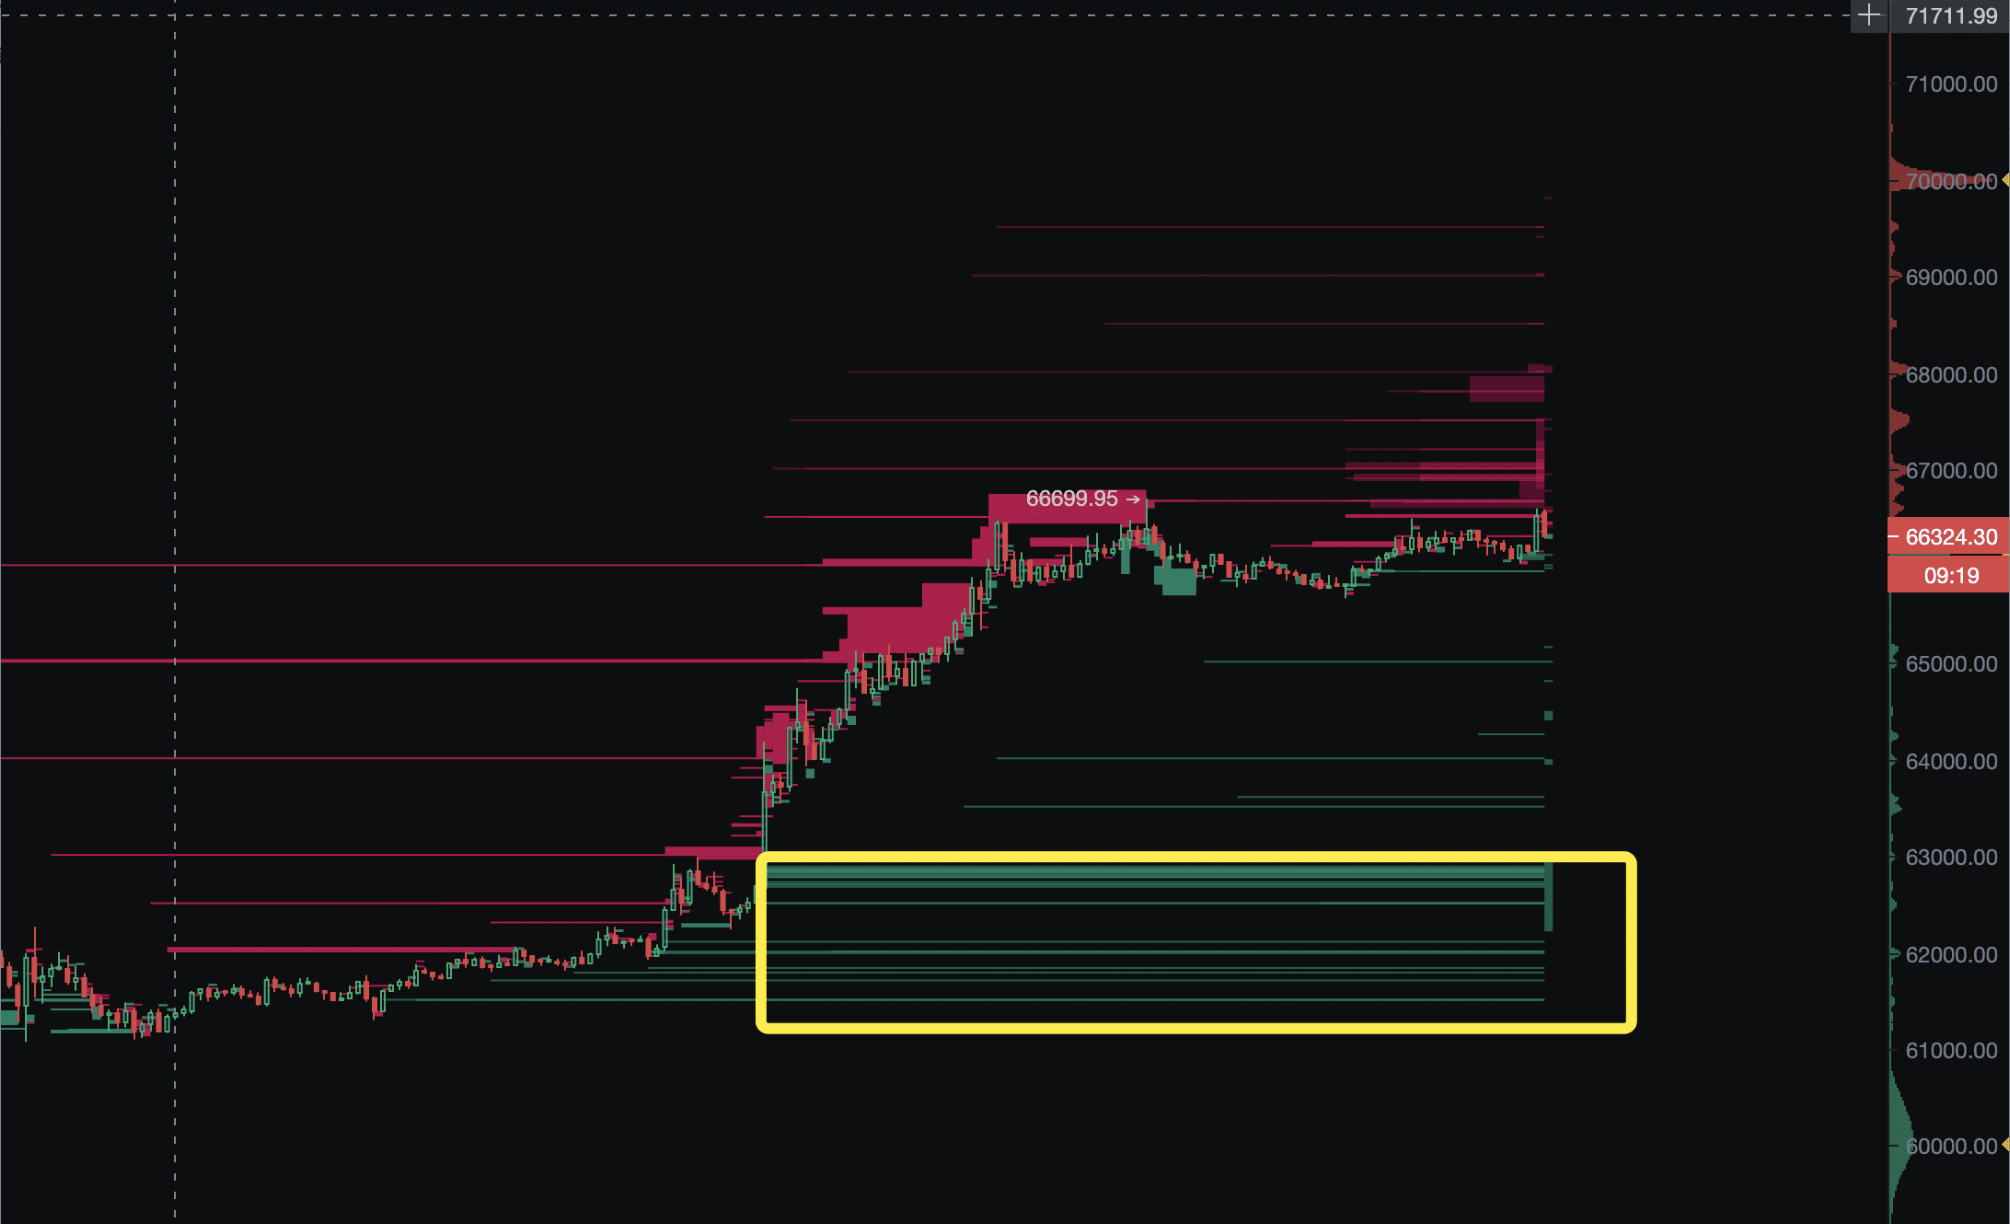
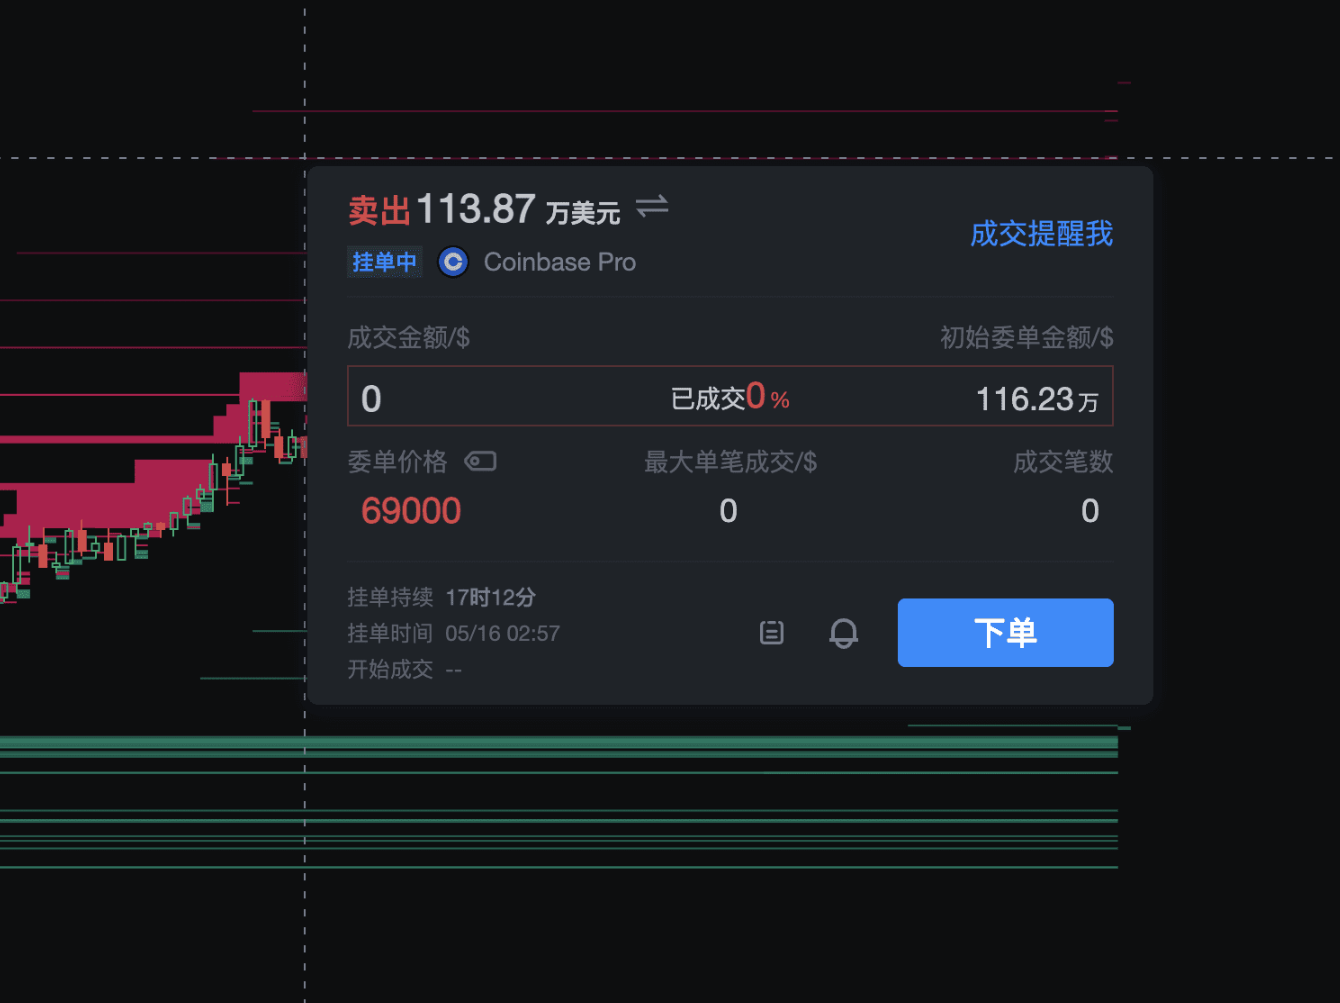
The main force at Coinbase has started hanging sell orders every $500.
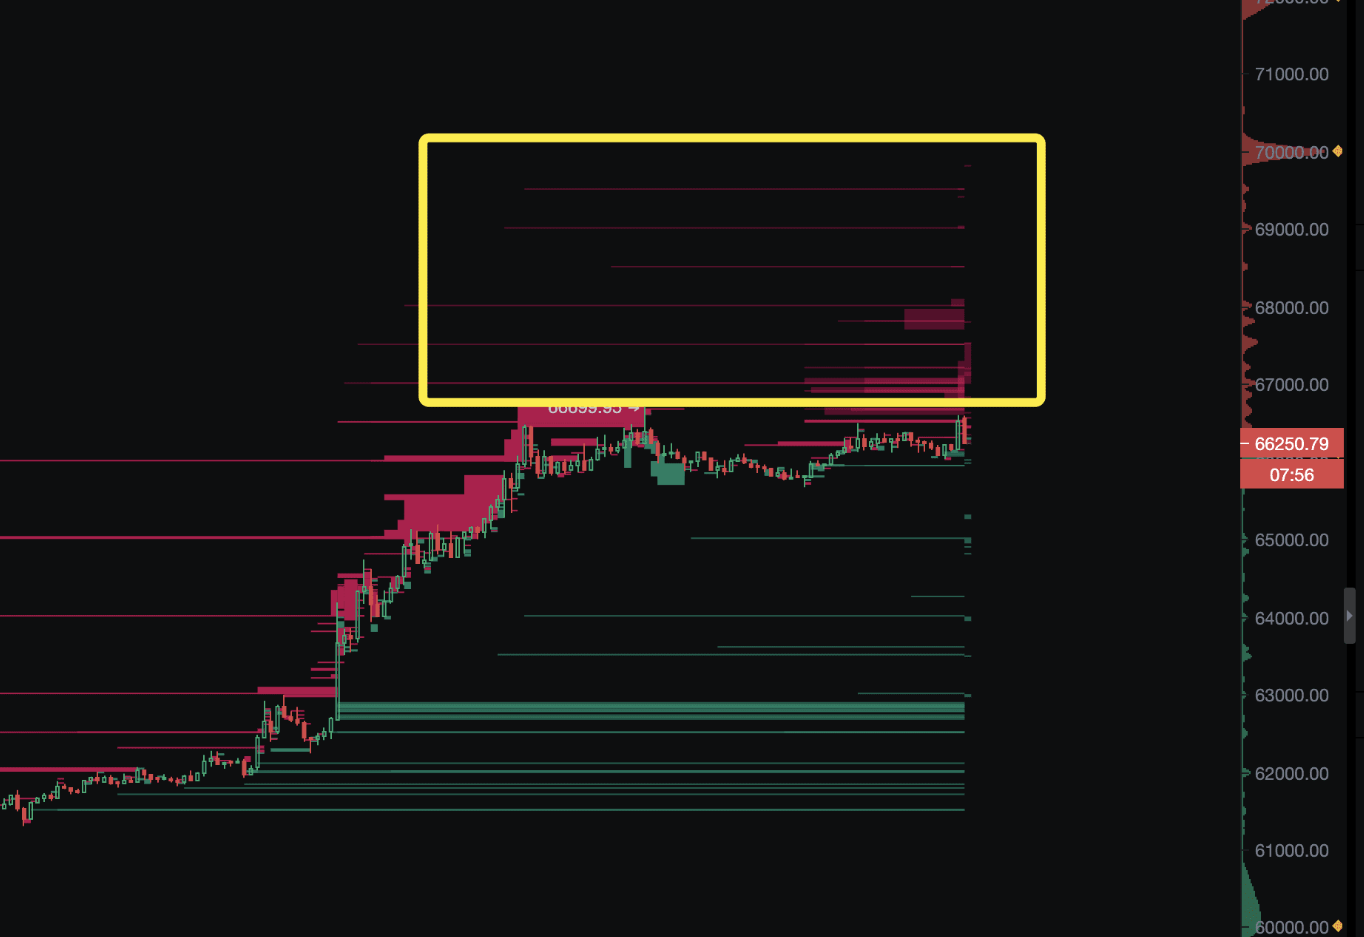
If the unemployment benefits data is favorable, it should continue to rise, but the pressure will increase.
PS: Move the mouse to the main force's large orders to see the specific situation of the large orders.
III. Q&A
1. What time is the main force's password released every night?
Every night from 7 pm to 10 pm.
2. "During an oscillation period, energy is generally accumulated, and the longer the oscillation, the more obvious the comparison by the main force, leading to more accurate predictions." Can this be observed using trading volume?
Trading volume can show the turnover situation, and combined with the main force's large orders, it can clearly show whether the main force is buying or selling more.
3. Where can I view the main force's password?
You can view it in the "Flash News - Main Force" section on the APP and PC.

4. Why look at the large orders on Coinbase?
Currently, Coinbase is the custodian for the vast majority of BTC ETFs, so the data is very significant.
5. Will Bitcoin reach $70,000 during this period?
If there is actual news of an interest rate cut, it's highly likely to reach $70,000, but the current situation is not very clear.
免责声明:本文章仅代表作者个人观点,不代表本平台的立场和观点。本文章仅供信息分享,不构成对任何人的任何投资建议。用户与作者之间的任何争议,与本平台无关。如网页中刊载的文章或图片涉及侵权,请提供相关的权利证明和身份证明发送邮件到support@aicoin.com,本平台相关工作人员将会进行核查。


