5.14 Empty Cut: Is there a conspiracy behind Ethereum?

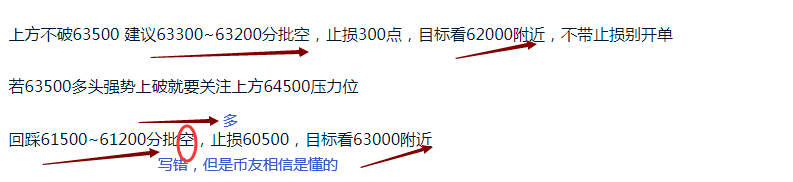
Today, following the brilliant results of the early morning trading battle, we successfully took a profit of 2000 points after pressing down on the 63500 line, which undoubtedly provides another strong validation of our strategy. After touching the 63448 line, we decisively fell back to around 61500 to layout long positions. Currently, we are standing at the rebound point near 62000, this precise and steady step once again proves our judgment.

ETH Daily Chart
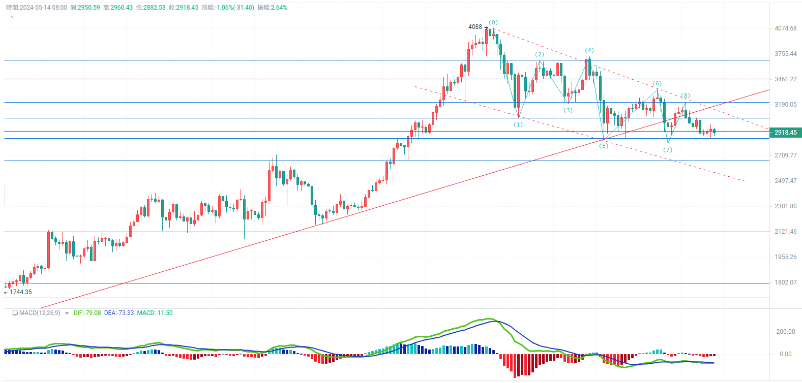
On the daily chart level, the current market presents a seemingly stable but actually oscillating downward trend. Although this trend seems negative, we cannot ignore the opportunities within it. In terms of technical indicators, the MACD line is running flat above the 0 axis, indicating that the market's momentum is not strong, but also suggesting that investors are taking a wait-and-see approach to the current trend.
Tomorrow's news and information will be our focus. If the market cannot find support in the downward trend, then it will face the risk of a reversal. At this time, any important news or policy changes could become the key to a market turning point. We need to closely monitor this information in order to make timely response strategies.
ETH Four-hour Chart
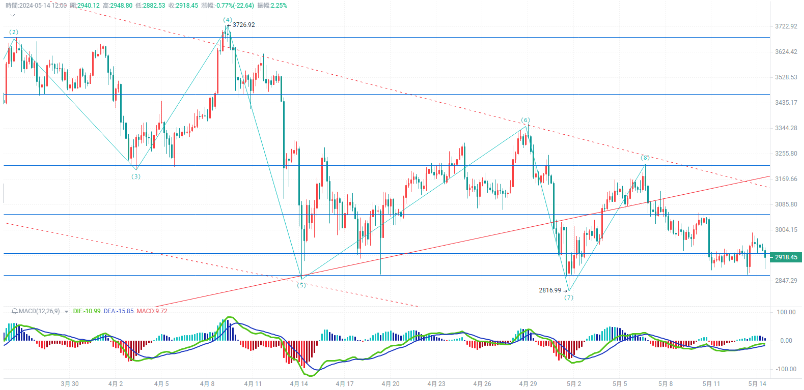
Looking at the four-hour level, in terms of technical structure, we observe that the line chart presents a descending wedge shape. This means that the current price is in a downward trend line, and the price fluctuations are gradually narrowing, showing a potential for a pending breakout. Yesterday, the coin price was resisted at the 3000 level and fell back, with the price retracing near 2880, so the 2850 level below is a valid support. Although there seems to be signs of a rebound, the overall trend has not changed. In this context, we need to closely monitor the dynamics of the price in order to better grasp the market's direction.
Resistance levels: 3000, 3050
Support levels: 2860, 2800
Buy in batches on the retracement to 2910-2880, stop loss at 2850, target to break 3000 and look near 3050,
If the upper side does not break 3000, it is recommended to short in batches on the rebound to 2930-2950, stop loss at 2990, target to break 2860 and continue to hold,
Take life seriously, life itself is a hyperlink, this time it's pain, next time it's a surprise, destiny will always favor you, life treats everyone fairly, and the market is the same, maybe you are not doing well now, but it won't be like this forever, someday, you will have it, gain it and I'm lucky, lose it and it's my fate, I don't believe in fate, because if I can change your fate, I can change mine.
Experience happiness, enjoy investing, investing is not your job, home is your eternal haven, facing setbacks, giving up is a shame, facing them is a duty!!

The above is a personal suggestion, for reference only. Investment involves risks, trading should be cautious, prioritize risk and then plan for profit, gains and losses are self-responsibility. There is no empty talk, no exaggeration, only a solid foundation of actual combat to create stable returns for everyone. Posting may have delayed market changes, the mentioned points in the article do not serve as a basis for follow-up. For more real-time market analysis, please follow the public account above for discussion and exchange.
免责声明:本文章仅代表作者个人观点,不代表本平台的立场和观点。本文章仅供信息分享,不构成对任何人的任何投资建议。用户与作者之间的任何争议,与本平台无关。如网页中刊载的文章或图片涉及侵权,请提供相关的权利证明和身份证明发送邮件到support@aicoin.com,本平台相关工作人员将会进行核查。


