Since BTC hit a new low of 56553 in this round of correction on May 1st, it has only experienced two days of bottoming out. On May 4th, it surged on heavy volume, directly forming a small to large V-shaped reversal and re-entering the 60000 level. The current price has reached around 64000.
From the perspective of the inflow and outflow of Bitcoin spot ETFs, the trend of Bitcoin is directly related to the net inflow and outflow of ETFs:

As can be clearly seen from the above chart, the previous weak trend of Bitcoin and the continuous decline were fundamentally caused by the continuous net outflow of several major ETFs. On May 1st, it experienced the largest outflow, directly pushing Bitcoin down to 56553. Subsequently, on May 3rd, there was a significant net inflow, reversing the trend. In the near future, the inflow and outflow of ETFs will continue to directly influence the trend of Bitcoin.
Returning to the current market situation, after a strong rebound, Bitcoin has returned to the lower boundary of the 4-hour center. The upper and lower boundaries of the center can be considered as traditional support or resistance. To break through the suppression of the lower boundary of the center, the bulls need to continue to accumulate strength through oscillation.

First, let's look at the daily chart at a higher level. At the current daily level, there is still a potential third buying point. There are two important reference points to confirm whether the daily third buying point is established: first, the MACD needs to re-enter the zero axis, and second, a second buying point needs to appear. At present, it is just running up as a rebound, and the MACD is still below the zero axis. Subsequent continuous tracking and observation are still needed. In short, using the 4-hour level segment as a short-term trading strategy is a more appropriate choice.
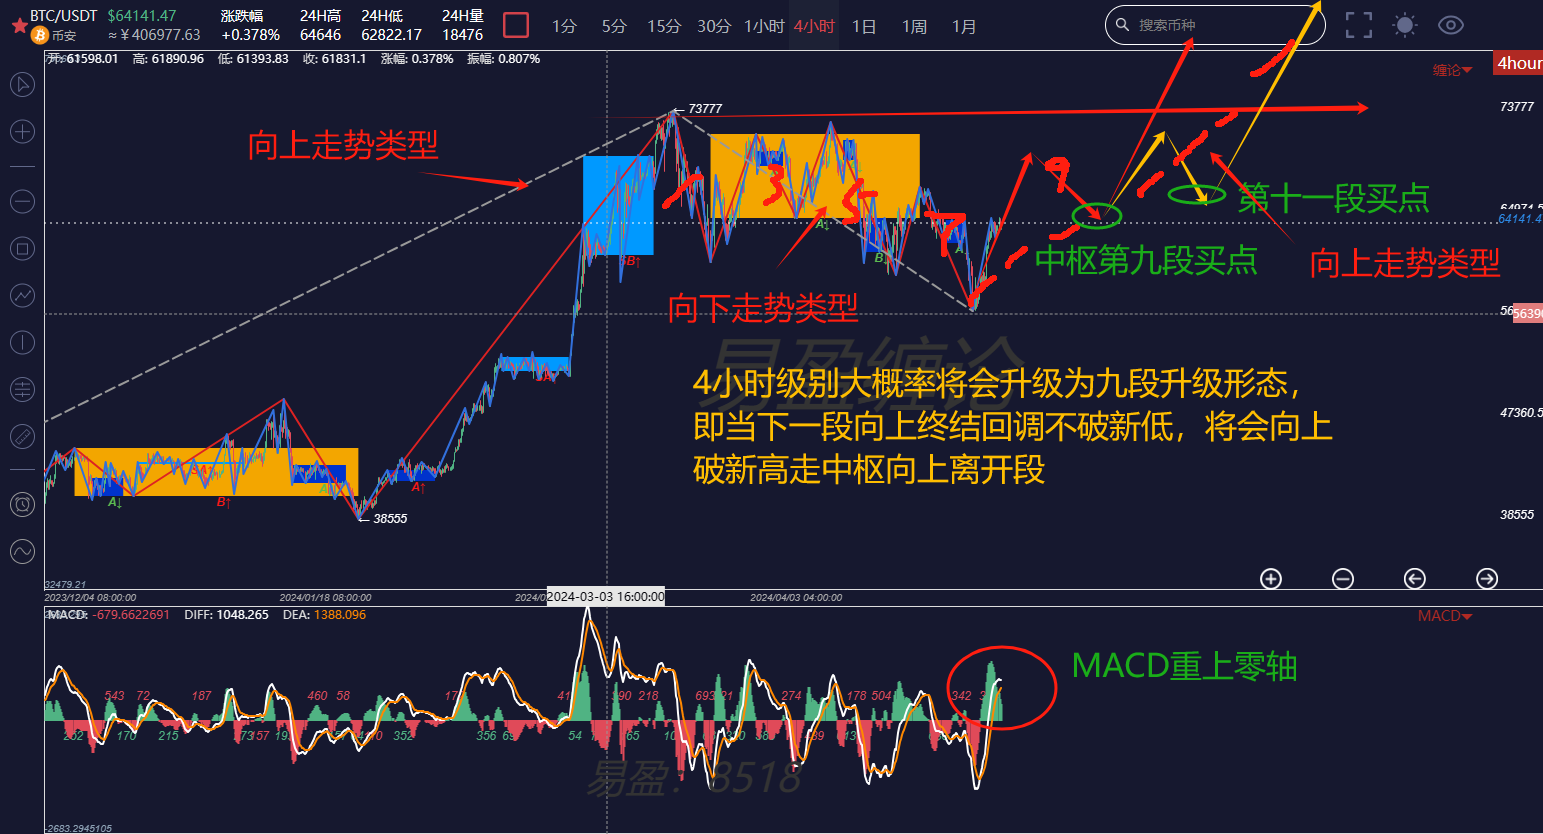
Now, let's look at the 4-hour chart. The trend at the 4-hour level has become very subtle! The current movement is the eighth upward segment of the 4-hour center, which means that the 4-hour level will grow into a nine-segment upgrade form. When a 4-hour second buying point or a similar second buying point appears, it can basically be confirmed that there will be a sharp rise above the historical high!
If you are interested in the "Chen's Theory" and want to obtain learning materials for free, watch public live broadcasts, participate in offline training camps for "Chen's Theory," improve your trading skills, and build your own trading system to achieve a stable profit goal, and use "Chen's Theory" to timely exit at the top and buy at the bottom, you can scan the code to follow the public account, privately message to obtain and add the WeChat of this account to join the group for learning!

免责声明:本文章仅代表作者个人观点,不代表本平台的立场和观点。本文章仅供信息分享,不构成对任何人的任何投资建议。用户与作者之间的任何争议,与本平台无关。如网页中刊载的文章或图片涉及侵权,请提供相关的权利证明和身份证明发送邮件到support@aicoin.com,本平台相关工作人员将会进行核查。


