Daily Sharing
As expected yesterday, Bitcoin has successfully rebounded on the 1-hour timeframe. In the short term, there may be another upward push on the 1-hour timeframe. It is anticipated that there will be a 1-hour timeframe pullback later, and the next pullback is crucial. If the next pullback is not significant, it may indicate a short-term higher-level rebound.
Many friends have recently asked me what to do with spot trading. Many people have incurred losses of tens of points or even halved their capital during this pullback. In reality, most of those who asked me were seeking reassurance rather than genuinely asking whether to cut losses. So I asked them, do you think the bull market has ended, or do you firmly believe that the bull market is still ongoing?
Most of them tend to agree that the bull market has not ended, especially since Bitcoin has only recently broken through its all-time high this year, indicating that there will be a new wave of increases. Then I said, if you all believe that the bull market has not ended, why panic? There are many market rumors, some say Bitcoin will drop to 45,000, some say it will drop to 38,000, some say the bull market has ended, and some say this round is only Bitcoin's bull market, unrelated to other currencies. What others say is not important; what matters is how you perceive it.
BTC Medium and Long Term
Weekly Chart:
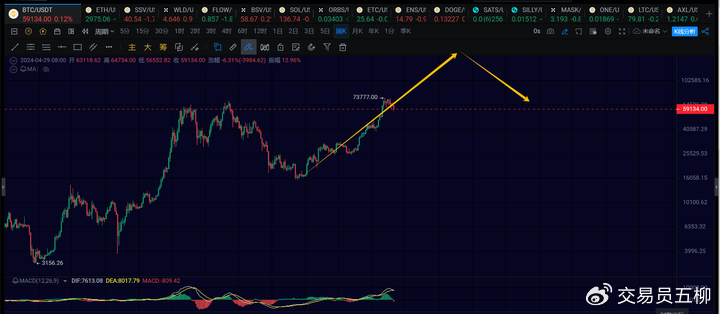
The upward trend on the weekly chart, starting from 15,476, is still ongoing. It is personally estimated that the target for the weekly chart's increase is in the range of 150,000 to 200,000, possibly by the end of the year or early next year.
Daily Chart:
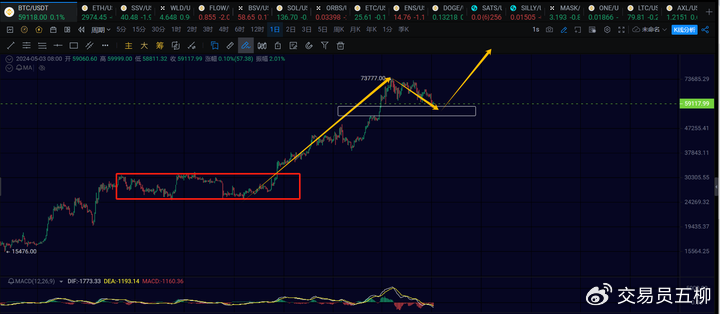
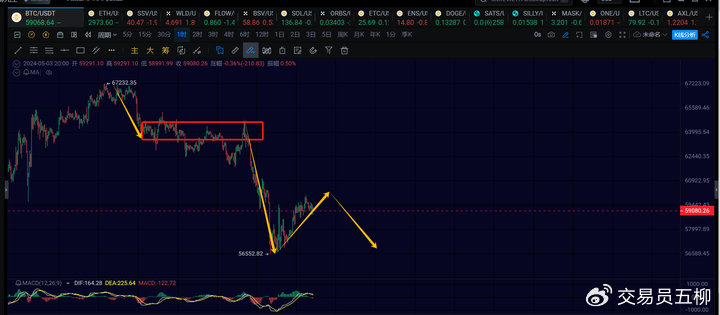
On the daily chart, Bitcoin is currently undergoing a pullback from 73,777. This pullback is likely the third buy of the daily chart, and further upward movement is certain. The key concern is whether this pullback on the daily chart has ended. Based on the internal structure of the daily chart pullback, the current pullback is almost complete. In the short term, attention should still be focused on the support around 55,000 to 56,000. If it can hold above this level, then the focus will shift to a new rebound on the daily chart.
4-Hour Chart:
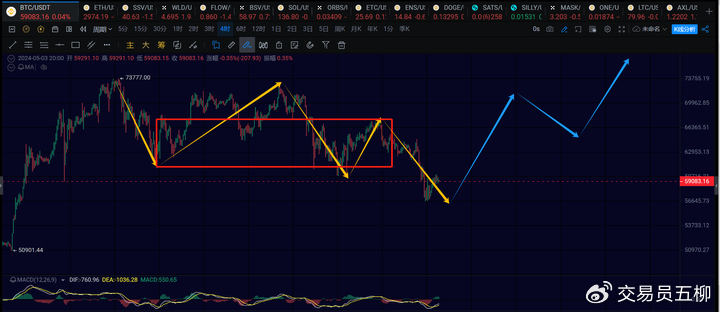
On the 4-hour chart, Bitcoin is currently in the midst of the fifth 4-hour pullback. This pullback still lacks a 1-hour level pullback. After the next pullback, if it can hold above 55,000, there is hope for a subsequent rebound on the daily chart. Based on the 4-hour chart's central trend, if Bitcoin breaks through 61,500, it means that the short to medium term outlook cannot be bearish anymore. Therefore, close observation of the 61,500 level is crucial, and a breakthrough would indicate a bullish bias.
BTC Short Term
Due to the rapid changes in the market, this article can only make predictions based on the market conditions at the time of publication. Short-term traders should pay attention to the latest market changes and use this information as a reference only.
1-Hour Chart:
On the 1-hour chart, there is still an ongoing rebound, which may extend further upward. It is expected that a pullback on the 1-hour chart will occur tomorrow. The focus will be on the intensity of this pullback. If it holds above 55,000, there is hope for a quick end to the pullback and the start of a rebound.
15-Minute Chart:

The ongoing rebound on the 1-hour chart may form a 15-minute central trend, followed by another upward extension. It is anticipated that a pullback on the 1-hour chart will occur tomorrow.
ETH

Ethereum is currently in the second 1-hour rebound. The resistance near 3,080 is expected to lead to a third 1-hour pullback. There is a probability that Ethereum may retest around 2,800 or the range of 2,750 to 2,800 in the next 1-hour pullback. However, if Ethereum breaks through 3,088, the subsequent 1-hour pullback may not necessarily break below 2,817.
Altcoins
Observing the recent performance of altcoins, many have already reached a temporary bottom after the recent decline. However, due to panic, many are hesitant to enter the market. It is expected that the darkness before dawn will soon pass. The next upward movement on the daily chart for Bitcoin and Ethereum may be stronger. Bitcoin may gradually rise, while Ethereum may need to pick up the pace. In this case, there is a chance for altcoins to quickly recover from the previous decline.
Trend Direction
Weekly Chart: Upward direction, currently a continuation of the rebound from 15,476. Pay attention to subsequent daily chart developments to determine when it will end.
Daily Chart: Downward direction, has reached support near 56,000. The daily chart pullback is expected to end in the next week.
4-Hour Chart: Downward direction, a 1-hour pullback is expected to follow the current 4-hour decline, unless there is a strong breakthrough above 61,500 in the short term.
1-Hour Chart: Upward direction, ongoing 1-hour rebound. Focus on 60,500 and 61,500.
15-Minute Chart: Upward direction.
Feel free to follow my public account for discussions and exchanges:

This article is time-sensitive. Pay attention to risks. The above is only personal advice and is for reference only!
免责声明:本文章仅代表作者个人观点,不代表本平台的立场和观点。本文章仅供信息分享,不构成对任何人的任何投资建议。用户与作者之间的任何争议,与本平台无关。如网页中刊载的文章或图片涉及侵权,请提供相关的权利证明和身份证明发送邮件到support@aicoin.com,本平台相关工作人员将会进行核查。


