2024.05.03 Friday

After the oscillation and rise, can the bulls continue to exert force?

① 20:30 US April Unemployment Rate
② 20:30 US April Non-Farm Payrolls
③ 22:00 US April ISM Non-Manufacturing PMI

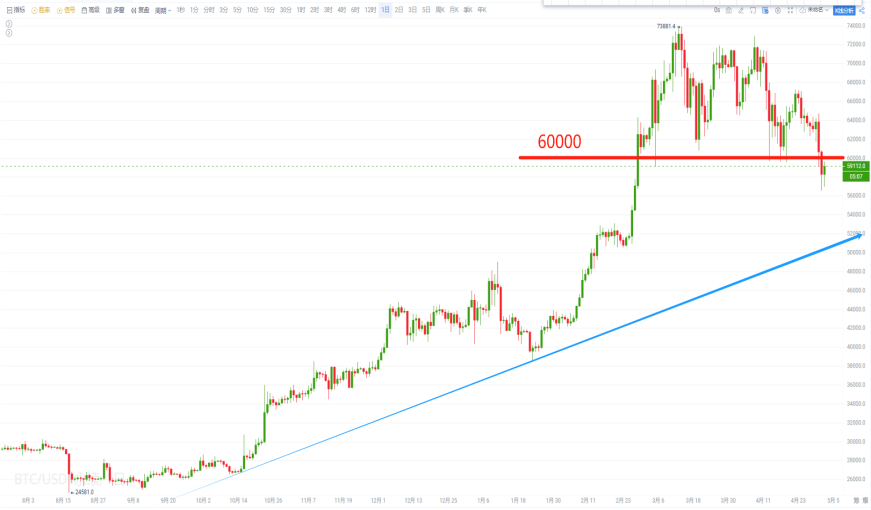
- Daily chart: After the price broke below the 60,000 support level, there was a rebound. If the rebound does not break this level later, there is still a downward trend.
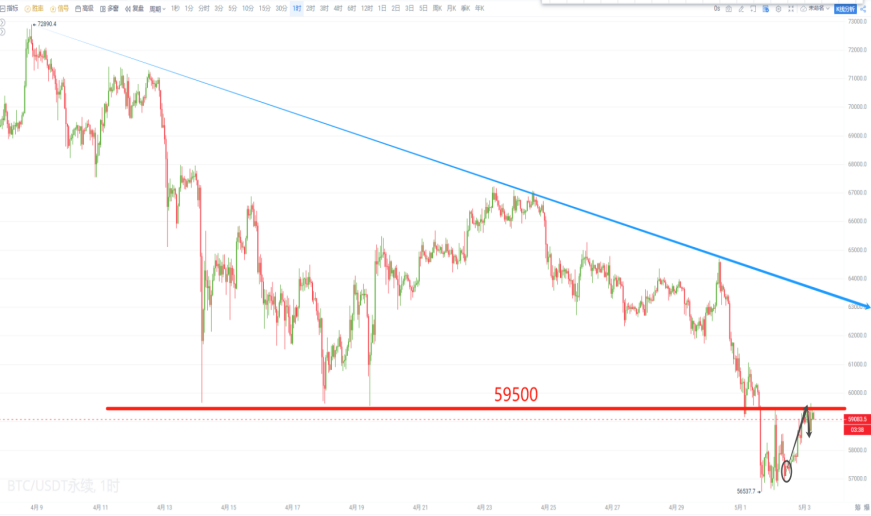
- 1-hour chart: After breaking below the 59,500 support level, there was a rebound. If the rebound does not break this resistance level later, there is still a downward trend.

II. Ethereum
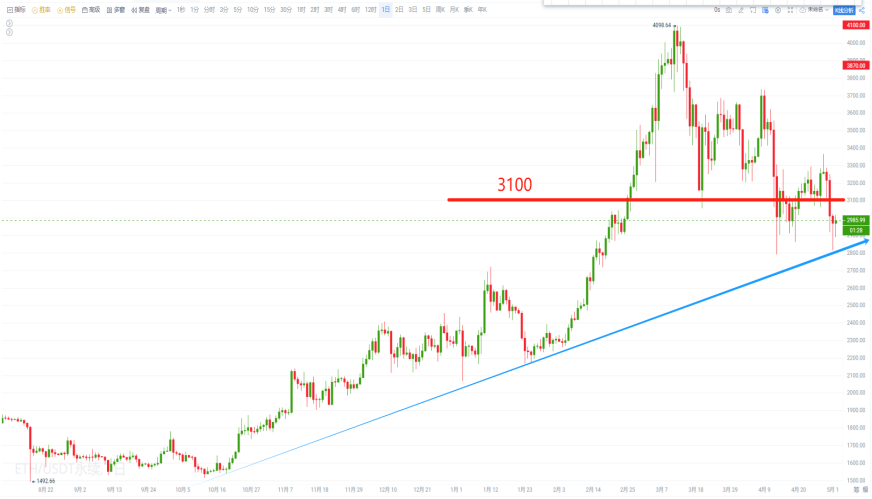
- Daily chart: After breaking below the 3,100 support level, there was some oscillation. If the oscillation does not break this support later, it is still an upward trend.
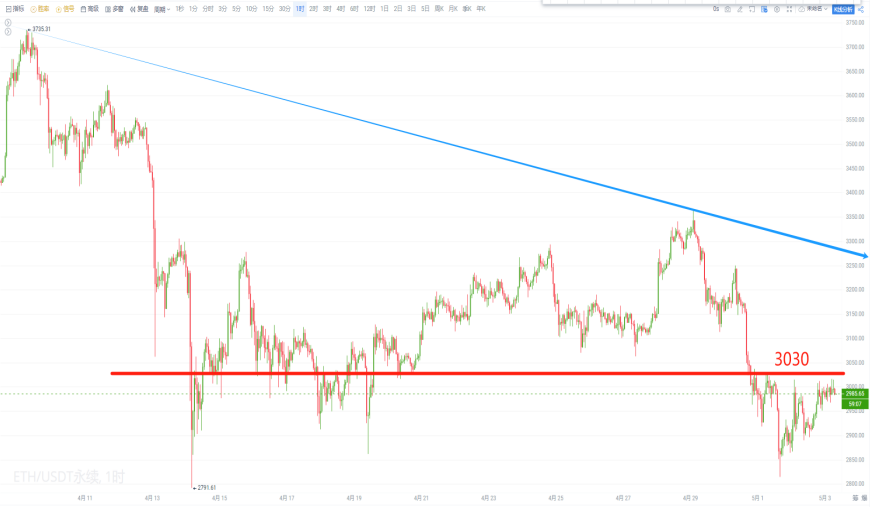
- 1-hour chart: After breaking below the 3,030 support level, it maintained oscillation below it. If the rebound does not break this resistance later, there is still a downward trend.

I. Bitcoin
- Yesterday's view:

Summary: After the price broke below the 59,500 support level in the short term, it maintained oscillation below it. If the rebound does not break this resistance later, there is still a downward trend. Support levels to watch below are 55,000 and 52,800; if it breaks above, it will initiate a rebound trend, with resistance levels at 61,800 and 64,300.
- Future trend:
The future trend faced pressure after the rebound failed to break the 59,500 resistance level, reaching a high of 59,637.
II. Ethereum
- Yesterday's view:
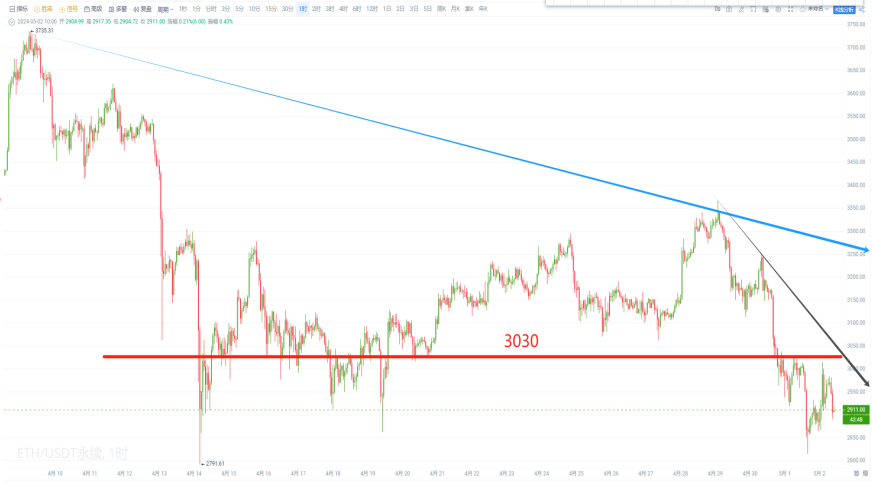
Summary: After breaking below the 3,030 support level in the short term, it maintained oscillation below it. If the rebound does not break this resistance later, there is still a downward trend. Support levels to watch below are 2,800 and 2,680; if it breaks above, it will initiate a rebound trend, with resistance levels at 3,150 and 3,295.
- Future trend:

The future trend faced pressure after the rebound failed to break the 3,030 resistance level, reaching a high of 3,016.

I. Bitcoin
Summary: After the price broke below the 59,500 support level in the short term, there was a rebound. If the rebound does not break this resistance later, there is still a downward trend. Support levels to watch below are 55,000 and 52,800; if it breaks above, it will initiate a rebound trend, with resistance levels at 61,800 and 64,300.
II. Ethereum
Summary: After the price broke below the 3,030 support level in the short term, it maintained oscillation below it. If the rebound does not break this resistance later, there is still a downward trend. Support levels to watch below are 2,800 and 2,680; if it breaks above, it will initiate a rebound trend, with resistance levels at 3,150 and 3,295.


Join the Pionex community to enjoy the following services:
Morning video explanation updated daily;
Daily updated text and image viewpoints;
Technical indicator analysis and answers in the group;
Layout of long and short strategies in the medium and long term;
High winning rate short-term trading strategies;
Trading system long and short signals reference software authorization;
Enjoy lower transaction fees by joining the community for practical combat;
One-on-one or one-on-many guidance and answers (by appointment);
Multiple learning courseware packages to bid farewell to incomprehension;
Multiple analysts (lecturers, practical teachers) guide you through the world of coins, with seven live courses daily
(Service content is continuously updated…)


免责声明:本文章仅代表作者个人观点,不代表本平台的立场和观点。本文章仅供信息分享,不构成对任何人的任何投资建议。用户与作者之间的任何争议,与本平台无关。如网页中刊载的文章或图片涉及侵权,请提供相关的权利证明和身份证明发送邮件到support@aicoin.com,本平台相关工作人员将会进行核查。


