Daily Sharing
Bitcoin once again fell to around 56500 last night. The downward trend on the 1-hour chart may have ended, and a short-term rebound on the 1-hour chart is expected. The resistance above is still around 59000 to 60000. It is expected that there will be limited strength in the rebound for the time being, and it may lean towards more oscillation. After the next downward trend on the 1-hour chart hits a new low point, it may end the downward trend on the 4-hour chart and the daily chart.
Bitcoin's daily chart is near an important support level. When the structure is almost complete, it is advisable to go long decisively. However, it may be better to wait a little longer for now. The spot market is still in a phase of bottom fishing opportunity.
BTC
Due to the rapid changes in the market, this article can only make predictions based on the market conditions at the time of publication. Short-term players should pay attention to the latest market changes and use this information as a reference only.
1H:
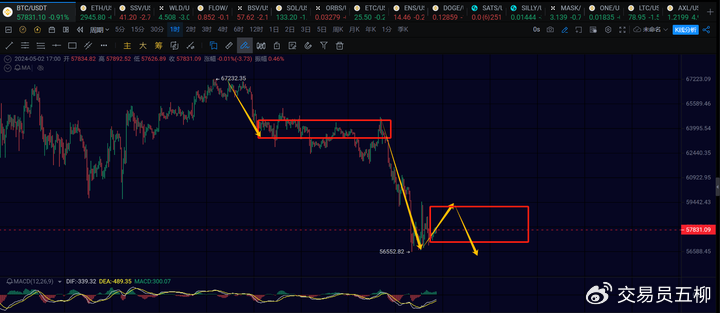
On the 1-hour chart, the downward movement of the 1-hour center of gravity leaving the segment has almost ended. It is now expected to have a 1-hour rebound, which is estimated to reach around 60000. Then there will be another downward movement on the 1-hour chart. However, after experiencing a rapid decline, the rebound on the short term is limited, and it is very likely to continue oscillating in the range of 57000 to 58700, consolidate a center of gravity, and then push below 60000, followed by another downward movement on the 1-hour chart to the range of 55000 to 56000.
It is advisable to wait a little longer for the structure to develop, with short-term oscillation as the main trend.
15M:

On the 15-minute chart, it is more inclined to consolidate a 1-hour center of gravity, repeatedly oscillating around the range, with 9 upward movements forming a 1-hour center of gravity, and then hitting a new low point to end the overall pullback. The main support below is at 56500 and 55000.
ETH
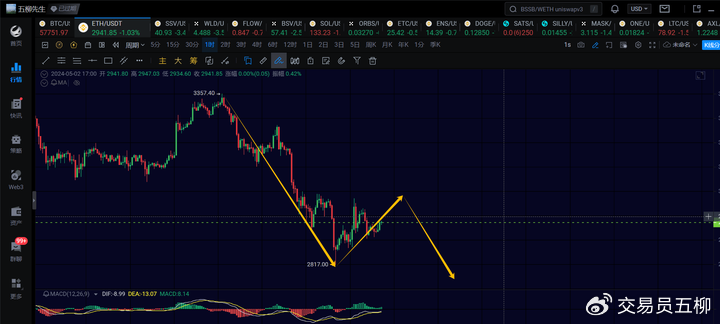
Ethereum is currently in the second 1-hour rebound of the fifth 4-hour downward movement. The current rebound is estimated to be around 3020, and there will be a third 1-hour downward movement in the future, with the potential to reach around 2750 to 2800.
Altcoins
The trend of altcoins is in line with personal expectations. As mentioned earlier, when Bitcoin falls below 59000 again, it is expected that many altcoins will retest the low point of the pin inserted on April 14. Some are strong, some are weak. The strong ones should not touch the tip of the pin inserted on the 14th, while the weak ones may fall below the previous low point of the pin. It is clear that many altcoins have already liquidated a large number of long contracts inserted on April 14. It is difficult to increase the short-term decline, and more likely to oscillate repeatedly at low levels.
Trend Direction
Weekly Chart: Upward direction, currently continuing the rebound from 15476, pay attention to the subsequent daily chart situation for when it will end.
Daily Chart: Downward direction, already reached the support around 56000, currently observing when the subsequent structure will be completed.
4-hour Chart: Downward direction, the 4-hour downward movement is ongoing, not yet finished, at least one more 1-hour rebound and one 1-hour downward movement are needed.
1-hour Chart: Upward direction, in the short term, expect a 1-hour rebound towards 60000. If it does not materialize, it is more likely to oscillate repeatedly to build a center of gravity.
15-minute Chart: Consolidating, the rebound strength is limited for the time being, and the probability of sideways oscillation is higher.
Feel free to follow my public account for further discussion and exchange:

The article is time-sensitive, pay attention to the risks, the above is only personal advice, for reference only!
免责声明:本文章仅代表作者个人观点,不代表本平台的立场和观点。本文章仅供信息分享,不构成对任何人的任何投资建议。用户与作者之间的任何争议,与本平台无关。如网页中刊载的文章或图片涉及侵权,请提供相关的权利证明和身份证明发送邮件到support@aicoin.com,本平台相关工作人员将会进行核查。


