
24/04/08BTC halving countdown 12 days, pressure below the converging triangle, reduce positions and wait for the opportunity to buy the dip!
24/04/10BTC converging triangle false breakout, increasing risks before halving, waiting for medium to long-term layout opportunities?
24/04/12BTC short-term needle insertion, unable to break through the pressure, significant decline during halving period inevitable?
24/04/13BTC multiple tops, significant distribution before halving, is it a buying opportunity or will it continue to decline, will a black swan event occur?

If we start counting from the breakthrough of 60,000 in this wave, it has been oscillating at a high level for 60 days. If we start counting from 73,777, it has been oscillating for 45 days. Bitcoin is prone to turning points in time cycles of 30/60/90…
Let's review. Since November 2022, there have been four obvious box patterns with false breakouts and false breakdowns. From 20,000 to 25,000, there was also a double top, with the lowest dropping to 19,568 and rebounding. Then there was a six-month oscillation from 25,000 to 31,800, followed by a drop from 40,000 to 49,000, with the lowest rebounding to 38,500.

It is not ruled out that there may be a rebound after a false breakdown in the recent oscillation from 59,600 to 73,777. We are also paying attention to this opportunity. MA120, MA200 as long-term moving averages in a bull market will not change easily, so we are also continuing to monitor.
Bitcoin The monthly chart is about to close with some dangerous signals, pay attention to the opening situation next month. The weekly chart's downside risk has not been resolved, and the daily chart's trend basically matches expectations. After the decline, the rebound is currently oscillating near 63,000, with the price falling to over 62,000 twice, showing signs of bullish divergence in the 4-hour chart. If the price can rebound to 65,300, it can be viewed as a bullish trend. If the rebound is not sustained, it will continue to test the support in the 59,600 to 60,600 range. Pay attention to the news about Franklin Templeton launching an Ethereum ETF, listing on DTCC, and the opening of the Hong Kong ETF in 3 days. Also, the abnormal movement of many large addresses recently is worth noting.
Support: Resistance:

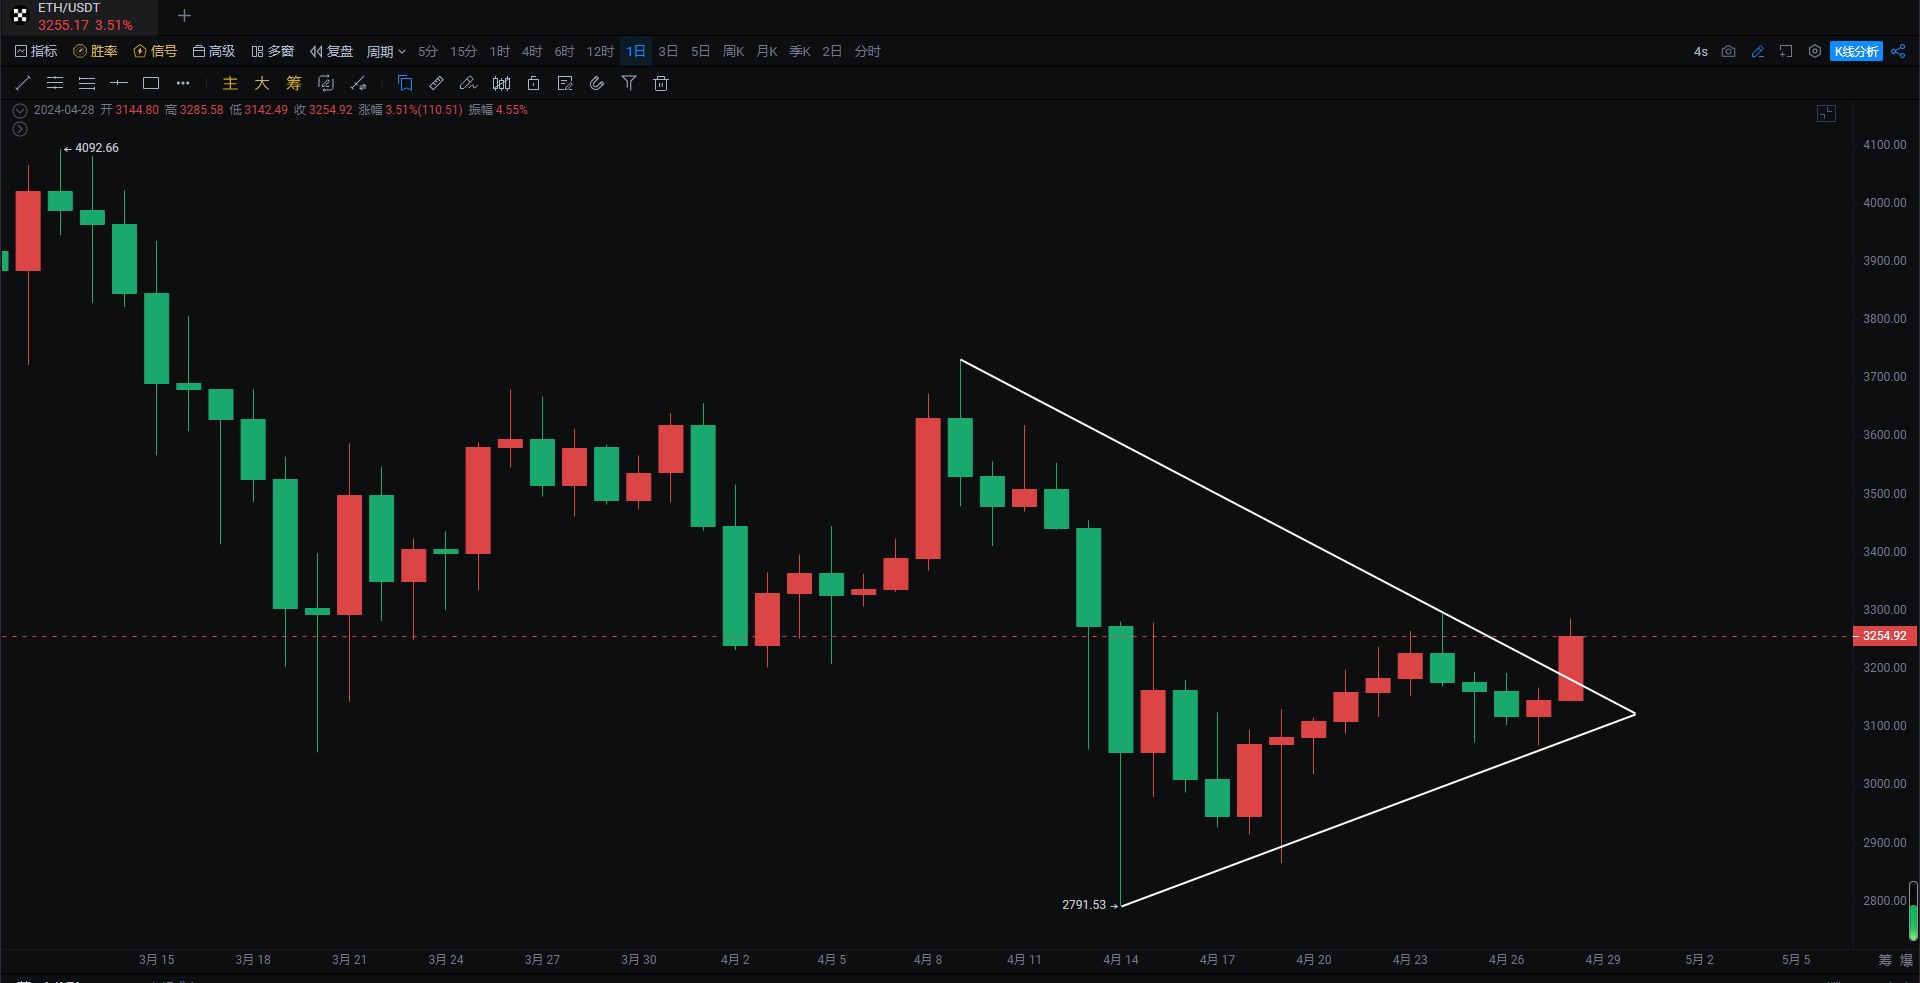
Ethereum The weekly MACD histogram crossed below the zero axis, and the fast and slow lines crossed, indicating a bearish bias in the long term, but there is a demand for rebounds in the short-term daily and 4-hour charts. The daily OBV indicator diverges from MACD, also indicating a demand for rebounds. The price rebounded twice from 3,067 to 3,073 in the 4-hour chart. Ethereum's rebound is stronger than Bitcoin's. The ETH/BTC exchange rate is oscillating at a low level and rebounding for two weeks. Pay attention to the strong rebound of altcoins such as HIGH, SSV, NEAR, OP, ARB…
Support: Resistance:
If you like my views, please like, comment, and share. Let's go through the bull and bear markets together!!!
The article is time-sensitive and is for reference only, with real-time updates.
Focus on candlestick technical research, win-win global investment opportunities. WeChat public account: 交易公子扶苏

免责声明:本文章仅代表作者个人观点,不代表本平台的立场和观点。本文章仅供信息分享,不构成对任何人的任何投资建议。用户与作者之间的任何争议,与本平台无关。如网页中刊载的文章或图片涉及侵权,请提供相关的权利证明和身份证明发送邮件到support@aicoin.com,本平台相关工作人员将会进行核查。


