4/22/Community: Bulls are starting to move; breaking through 3300 to see 3500
Mastering the long and short reversal signals is the first step in trading!
Live broadcast sharing various mainstream technical indicator application methods, as well as daily technical analysis;


[ETH/Daily Chart/4H Chart]
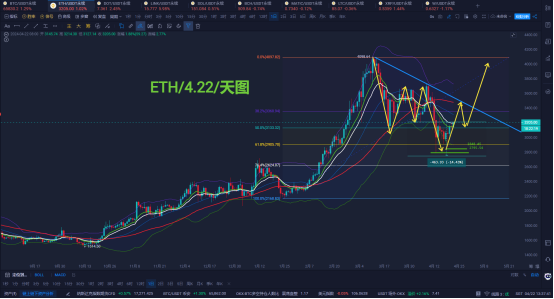
ETH Trend Analysis and Viewpoints: Yesterday, Ethereum's daily chart closed with a doji star, with little reference value; continue to use the train of thought from yesterday;
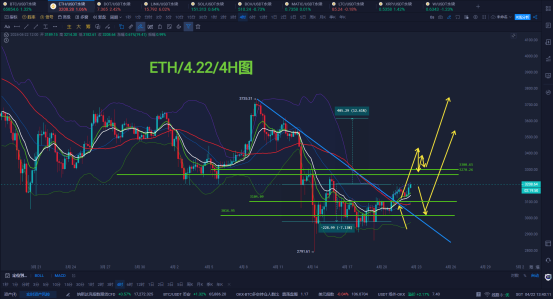
Ethereum's trend this week shows a trend of first suppression and then rise. The first half of the week saw oscillation and decline, and the second half of the week saw oscillation, bottoming out, and rebounding. The weekly chart has formed a long-legged doji star pattern; on the daily chart, it has shown a classic long signal of multiple reversals; Wednesday and Thursday saw a bottoming out and a breakthrough, and Friday saw a long-legged doji star, with a small bullish candle on Saturday closing at 3155. From a rebound perspective, the target can be seen at 3400-3500; in terms of the 4-hour price trend, it is expected to be more consistent with the price structure at the end of March. The current three moving average golden cross has been effectively established. In terms of structure, it forms a head and shoulders bottom pattern, with the left shoulder at 3000, the head at 2920, and the right shoulder at 3020; the neckline at 3120 has been effectively broken. Therefore, according to a one-time space calculation, 3120+200=3320, and if calculated twice, 3120+400=3520; it is suggested to focus on long positions!
[ETH/4H Chart Contract Market Long and Short Data; Updated daily at 12:00 PM]
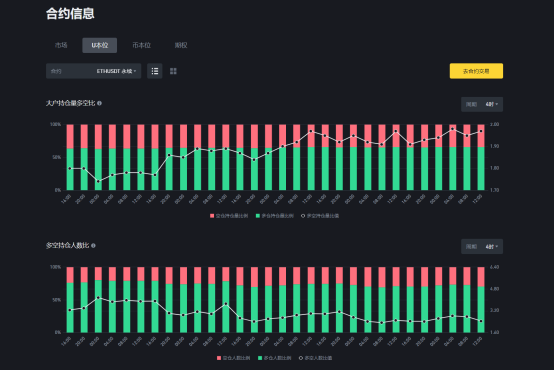
ETH/4-hour contract long and short data tracking:
1. Large traders' long/short position ratio: Short position volume ratio: 33.65%; Long position volume ratio: 66.35%;
Long/short position volume ratio: 1.97
2. Long/short position volume ratio: Short position number ratio: 28.96%; Long position number ratio: 71.04%
Long/short position number ratio: 2.5
The position data remains basically consistent with yesterday; today, the overall long position volume and the number of long positions have increased, indicating a strong willingness of the market to buy long positions in the 2800-2900 range! With the recent trend performance, the 4-hour head and shoulders bottom has been established, and the three moving average golden cross has been effectively established. The current price is near 3620, and long positions can be tentatively entered with light positions to defend at 2980; the first target for long positions is 3350, and upon reaching that, the second target is 3500! For more details, welcome to join the live broadcast room for discussion and learning!

Recommended Strategy [Oscillation with a Bias Towards Strength]
Support 3000-3020/Resistance 3300-3350
Tencent Meeting ID: 565-877-8060
Five live broadcasts daily: 14:00-21:30 uninterrupted

ETH/DOT Short Strategy Tracking Conclusion: Comprehensive returns at 1200%-1400%
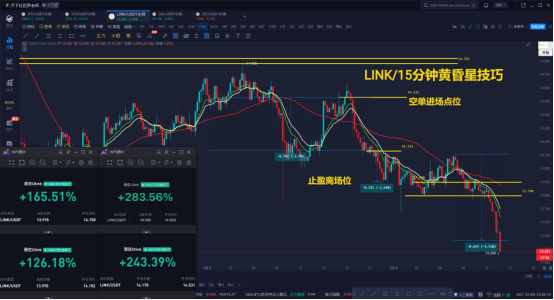
LINK/4H Strategy Tracking Conclusion: On March 22-23, the expected 4-hour head and shoulders bottom pattern and the first and second long targets at 19.5-20 were perfectly reached, with the highest price reaching 20.765; for those who have seriously followed and executed this strategy, the returns should be between 600% and 1000%; we will continue to track the next long and short opportunities for LINK!

[Hunt for Gold House] What can you get from the Elite Class???
1. Get the midday video at the first time//2. Get market intraday viewpoints at the first time
3. Get short, medium, and long-term strategies at the first time//4. Track and guide the strategy throughout
5. Have the opportunity to participate in the exclusive midnight battle//6. Have the opportunity to participate in million-dollar value courses
[Efficient. Accurate. Breakthrough Trading Opportunity Capture]

2022 Annual Strategy Guidance Record
February-December 2022///10 wins, 1 loss
February complete/return rate 2500%///March complete/return rate 2500%
April complete/return rate 2626%///May complete/return rate 3698%
June complete/return rate 3081%///July complete/return rate 7033%
August complete/return rate 4694%///September complete/return rate 5046%
October complete/return rate 1438%///November complete/return rate 2362%
December complete/return rate -474%///
February-December 2022 complete total return 34504%
Single margin 100U calculation*34504%=34504U
Each strategy//has evidence and can be traced back to the start time, year, month, day, hour, minute, and second, with graphic and textual records//If interested, scan the code to join the group for verification!!


(Scan the code to follow the official account and experience more services)
免责声明:本文章仅代表作者个人观点,不代表本平台的立场和观点。本文章仅供信息分享,不构成对任何人的任何投资建议。用户与作者之间的任何争议,与本平台无关。如网页中刊载的文章或图片涉及侵权,请提供相关的权利证明和身份证明发送邮件到support@aicoin.com,本平台相关工作人员将会进行核查。


