
Weekly line closed with another doji, this round of oscillation has seen four weekly pinbars, and has once again found support around 69000-60000. The rebound has lasted for 6 days and has currently broken through 66000, with the next target being 68000.
Ether's weekly doji closed above the previous low of 3056. The previously drawn ascending channel still provides support and resistance, with a current view towards 3300.
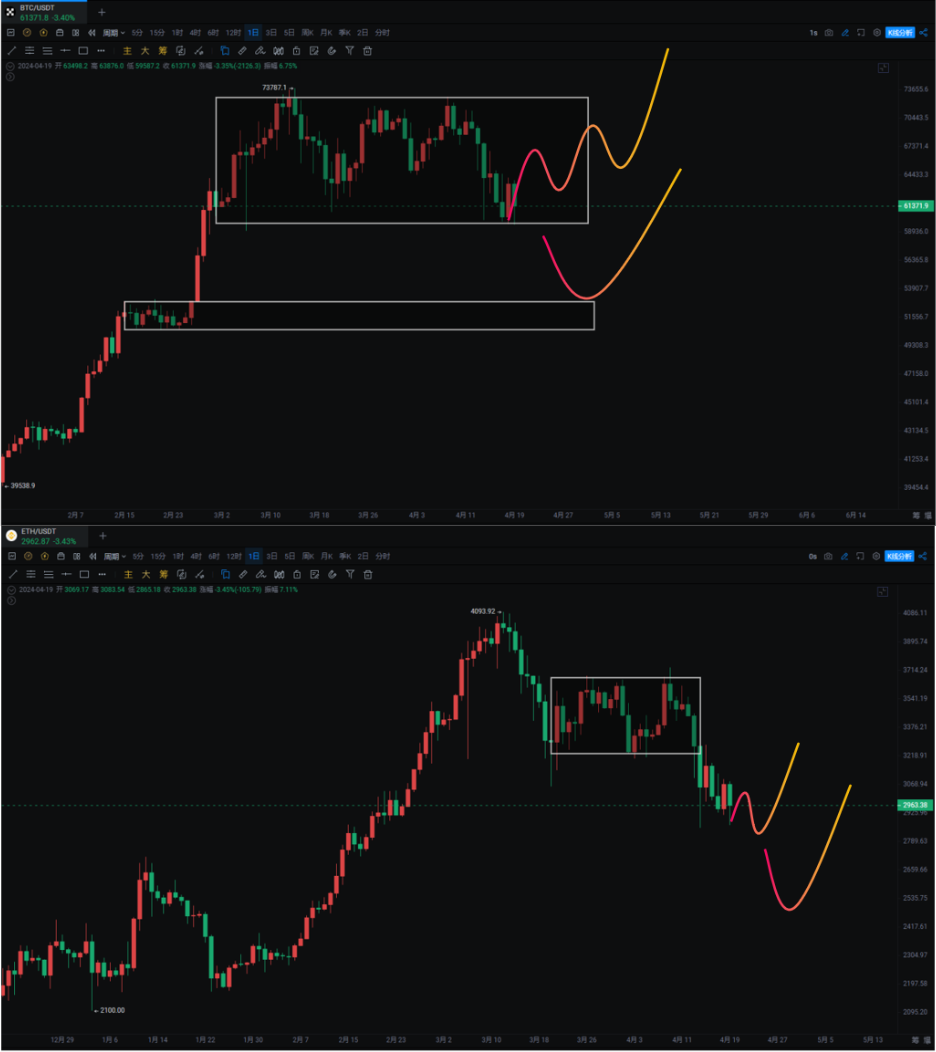
In terms of news, US stock funds are selling at a new high for the year, and the Federal Reserve may postpone interest rate hikes until September. The US stock market has experienced varying degrees of decline, and the US dollar index has touched 106.51, with a retreat from 107 seemingly imminent. It is worth noting that if the US dollar index breaks through 107 and heads towards 114, it may lead to more small economies collapsing due to inflation. It is uncertain whether Asia can withstand this impact, and it also faces the dilemma of whether to maintain exchange rates or stock and bond markets.
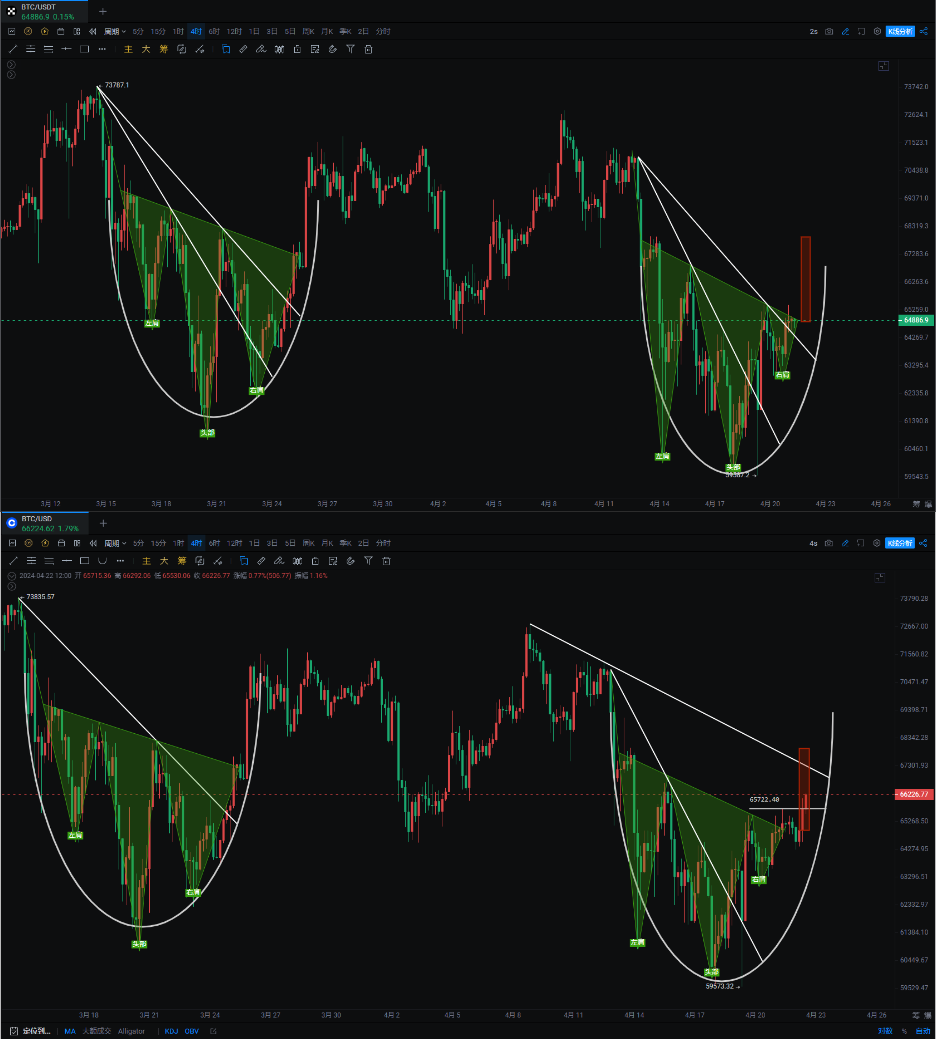
Bitcoin
The daily line continues its rebound, breaking through 66000, and also reclaiming the previous M-shaped neckline, indicating a bullish bias. We have been observing the rebound since the 17th, with the lowest point on the 18th dropping to 59600, which suggests that aggressive investors can enter the market to bet on the rebound. It was also mentioned that there might be one final drop, but based on the current market situation, as long as 59600-60600 is not broken, there is no downside in sight for the time being. This presents an opportunity for a second bottom-fishing and medium- to long-term layout.
4-hour chart
Yesterday, it was also mentioned that a rebound similar to the previous high drop might occur, and if it falls below 60600 and rebounds to reclaim the rounded bottom and head and shoulders pattern, it would still be valid. A head and shoulders pattern breakout also emerged in the morning. The next resistance is at 68000-69500.
Support:
Resistance:
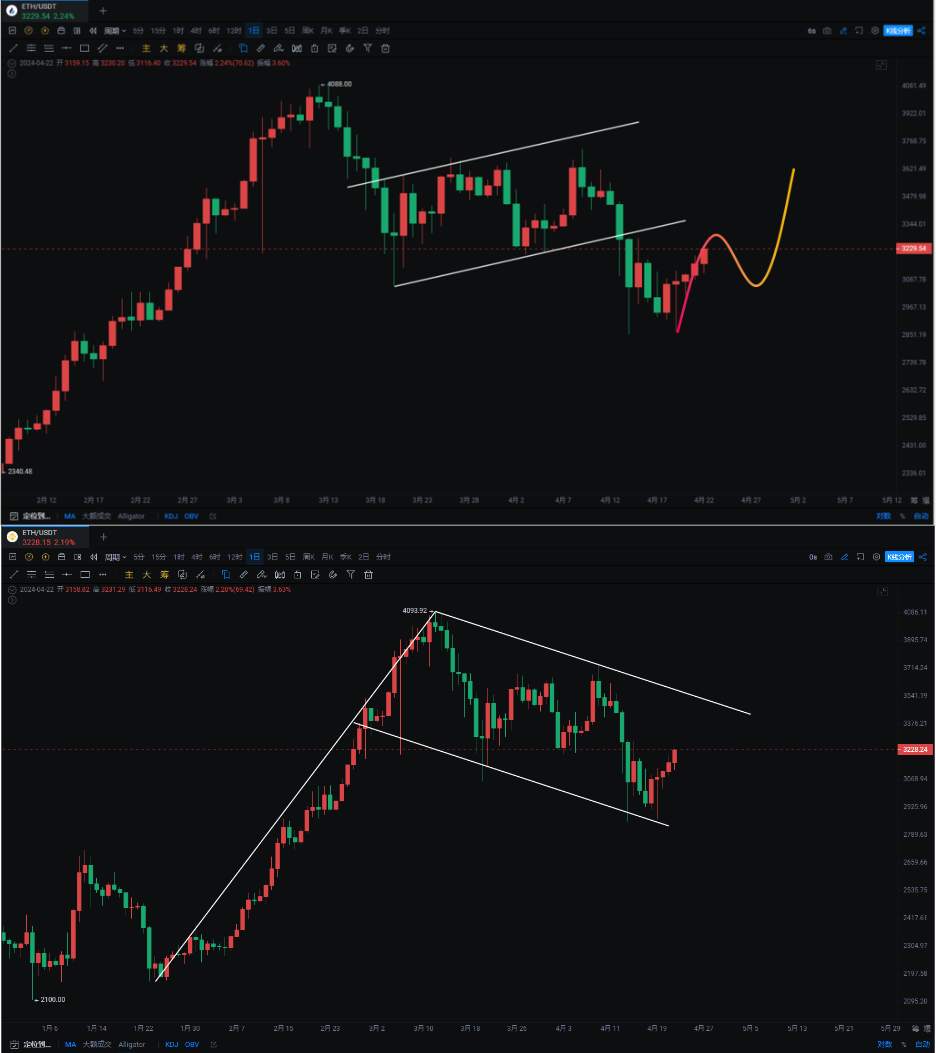
Ether
Ether's daily line has followed a downward channel, which also forms a descending flag. If this flag pattern breaks upwards, there is a chance it could surge to 4800.
In the next few days, Ether must stabilize and reclaim the 3300 level to end this round of decline, otherwise it may continue to explore the bottom.
Although ETH/BTC has reclaimed the previous bottom, it has not yet reclaimed the 0.051 box, and a rebound is still under pressure within the box.
Support:
Resistance:
If you like my views, please like, comment, and share. Let's navigate the bull and bear markets together!!!
The article is time-sensitive and is for reference only, with real-time updates.
Focusing on candlestick technical research, for a win-win global investment opportunity, follow the public account: 交易公子扶苏

免责声明:本文章仅代表作者个人观点,不代表本平台的立场和观点。本文章仅供信息分享,不构成对任何人的任何投资建议。用户与作者之间的任何争议,与本平台无关。如网页中刊载的文章或图片涉及侵权,请提供相关的权利证明和身份证明发送邮件到support@aicoin.com,本平台相关工作人员将会进行核查。


