BTC officially completed its fourth halving at around 8 o'clock on Saturday morning, and once again we witnessed history!
After each previous halving cycle, a turbulent and grand bull market peak has emerged in the market for about half a year to a year. Will history repeat itself this time? We wait and see!
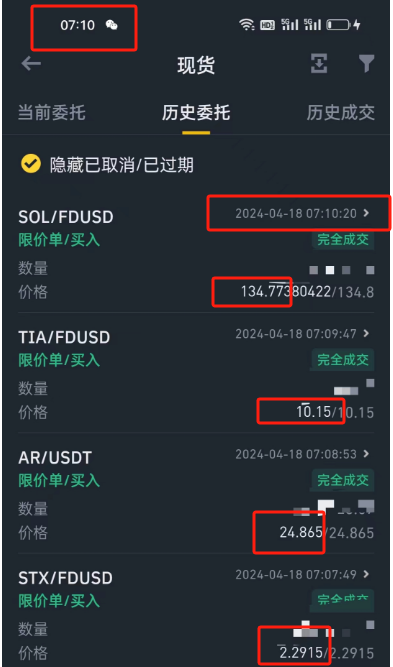
The trend of BTC is as analyzed and deduced last week. It plunged to a new low of 59600 after a bear trap around 10:30 on Friday morning, and then launched a strong rebound, reaching a high of 65700. The powerful rebound of 6100 points, exceeding 10%, dealt a heavy blow to the bears. This account bought several altcoins in the community for spot trading around 7 o'clock on the day when BTC plummeted last Thursday morning. They have all risen by 10 to 20 points or even 30 points. Congratulations to the followers who kept up with the pace! And the larger trend has not finished rising yet, so you can continue to hold. If you have the ability to trade short-term on small timeframes, you can use part of your position, otherwise, just hold steady. When there is a major selling point, a prompt will be given in the community.
Returning to the BTC market, its trend is as analyzed on Friday, and the trend is even stronger than deduced. Currently, the 4-hour MACD of BTC has returned to above the zero axis, and the bulls have regained control of the market.
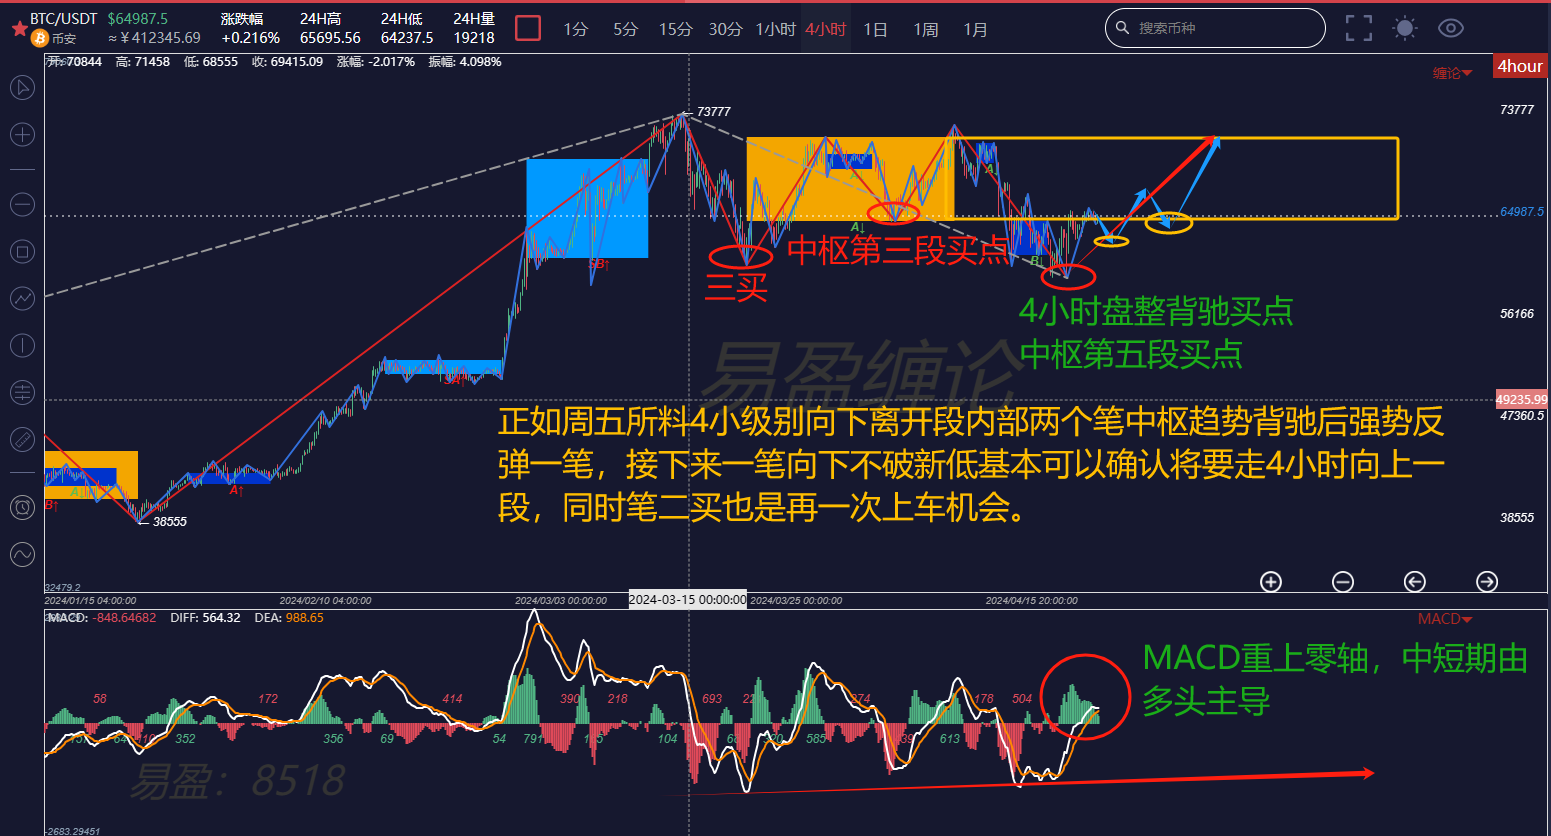
First, look at the 4-hour chart. The article on Friday clearly indicated that the 4-hour center left the internal trend and formed two pen centers of the downward trend divergence, indicating a high probability of an upward rebound in the 4-hour timeframe. The rebound has now reached 65000 points, with a strength exceeding expectations. As long as a secondary 30-minute buy signal appears, it can be basically confirmed that there will be an upward movement in the 4-hour timeframe towards the upper edge of the center. Whether it can break through to a new high remains to be further observed and followed.
Many novices who are not familiar with the Ichimoku technique may feel confused as to why the senior brother can make such confident and precise judgments about the trend reversal and put them into action. In fact, there is no secret to it, it is simply having enough confidence in the Ichimoku technique and a clear Ichimoku structure (the appearance of two pen centers of the downward trend divergence within the large timeframe line segment often indicates that the market is about to reverse).
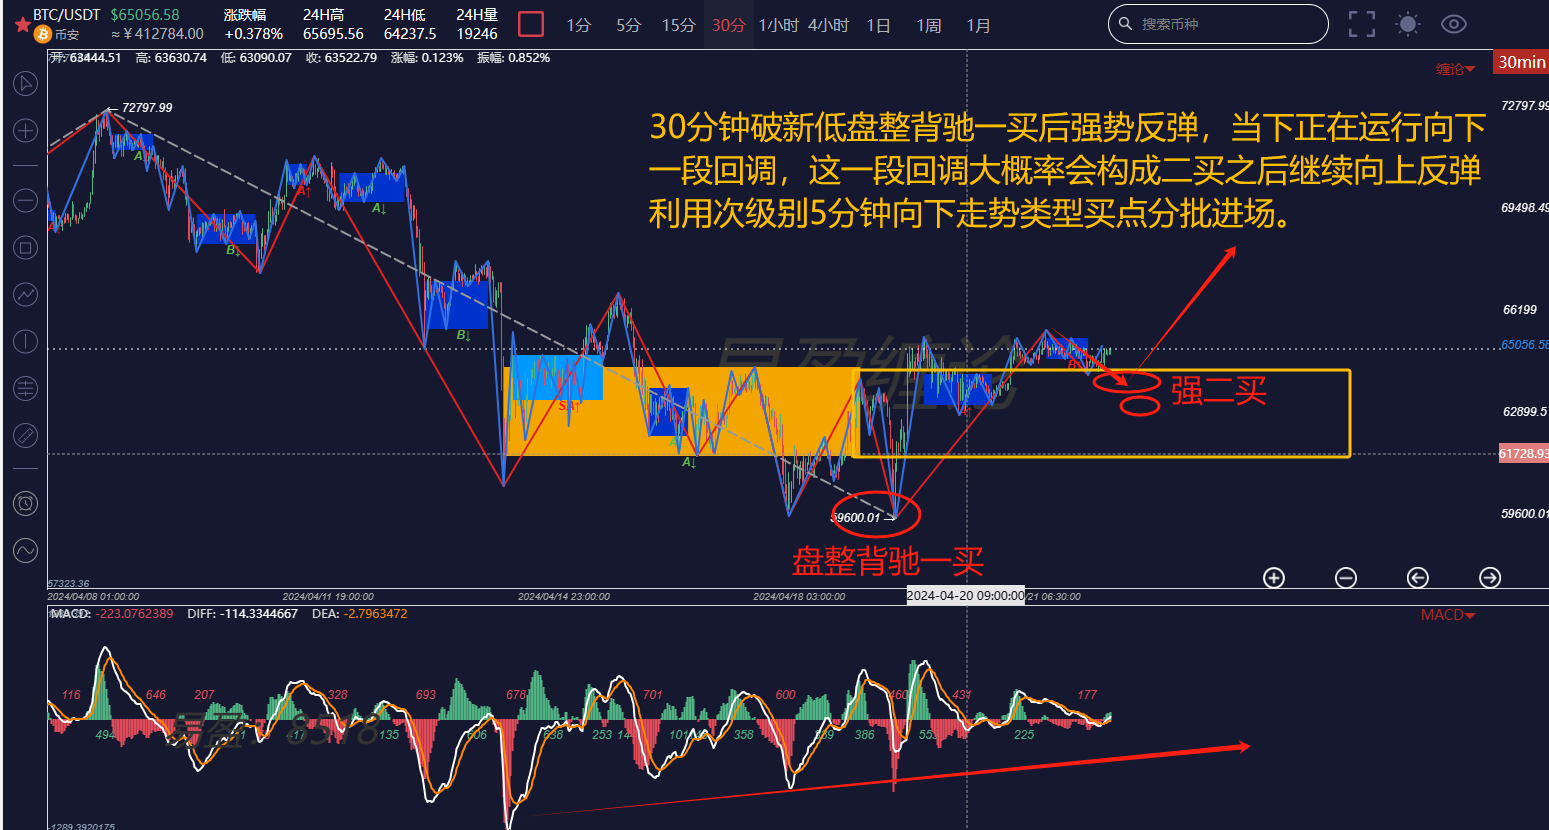
Looking at the 30-minute chart, after breaking the new low, a consolidation divergence buy signal appeared, followed by a strong upward rebound and a breakthrough of the center. Currently, it is undergoing a downward retracement, and a high-level strong buy signal is likely to appear after the retracement, followed by a continued upward rebound. Therefore, pay close attention to the buy signals of the downward trend type on the smaller 5-minute timeframe and gradually enter the market. It is highly likely that the 30-minute buy signal will appear today or early tomorrow morning.
If you are interested in the Ichimoku technique, want to obtain learning materials for free, watch public live broadcasts, participate in offline Ichimoku training camps, improve your trading skills, build your own trading system to achieve stable profitability, and use the Ichimoku technique to timely escape the peak and bottom, you can scan the code to follow the public account, private message to obtain and add the WeChat of this account to join the study group!

免责声明:本文章仅代表作者个人观点,不代表本平台的立场和观点。本文章仅供信息分享,不构成对任何人的任何投资建议。用户与作者之间的任何争议,与本平台无关。如网页中刊载的文章或图片涉及侵权,请提供相关的权利证明和身份证明发送邮件到support@aicoin.com,本平台相关工作人员将会进行核查。


