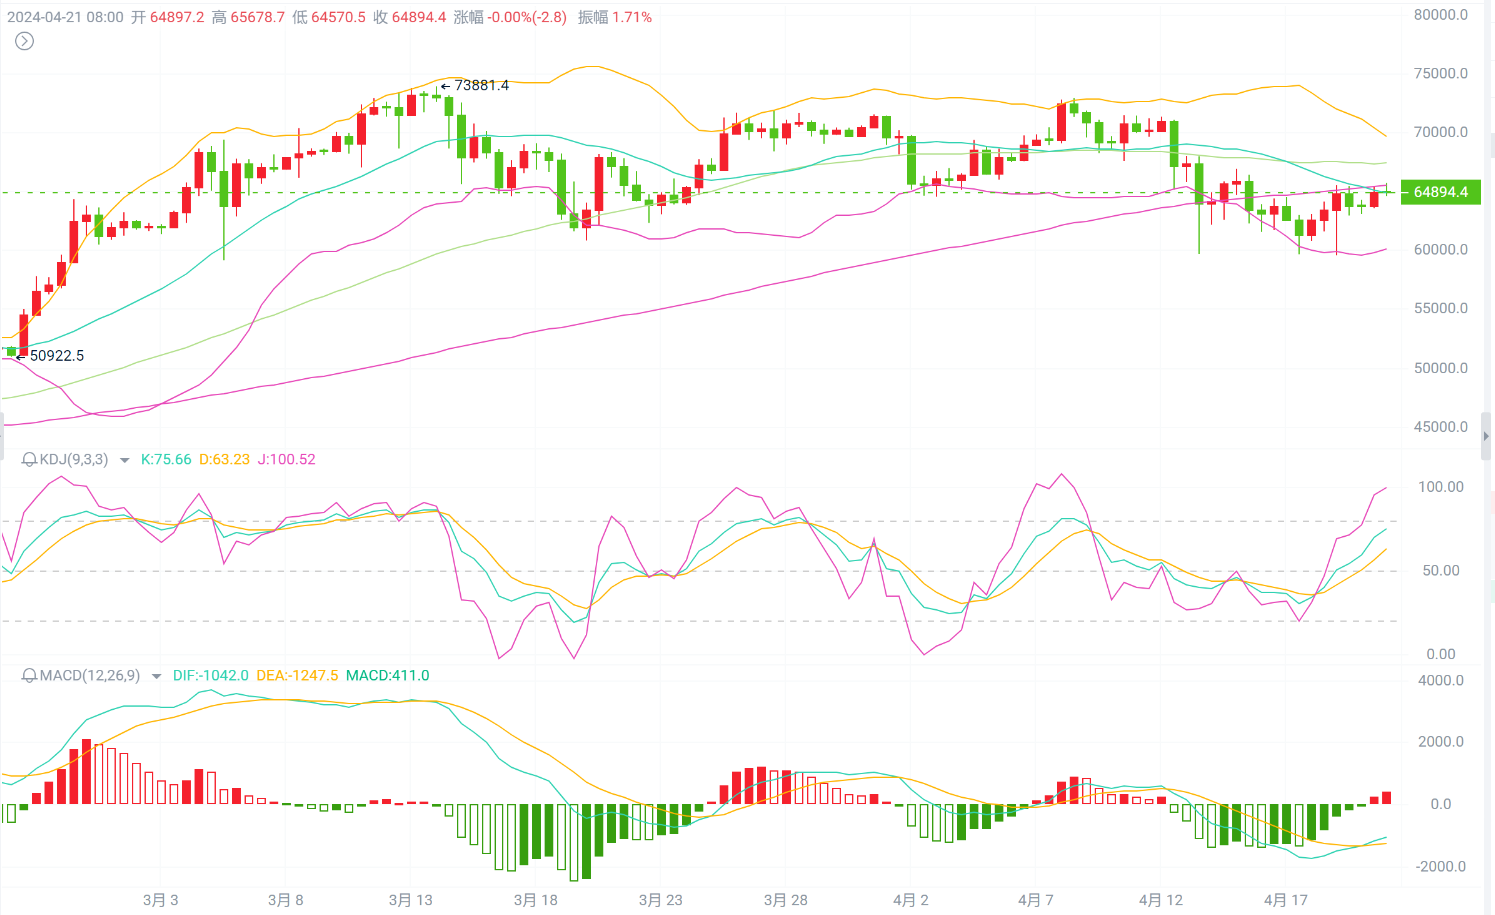
In terms of the daily chart for Bitcoin/Ethereum, the current KDJ has a golden cross and is rising, while the MACD continues to be bearish with decreasing volume. The short-term coin price is expected to continue oscillating and rebounding within the Bollinger Bands. Looking at the 12-hour chart, the current KDJ and MACD have a bullish cross and are rising together, while the Bollinger Bands are pressing down on the current upper and middle rails. However, there has been a technical change in the short-term coin price with a breakthrough of the middle rail. In the ultra-short term, it remains to be seen whether the middle rail can be effectively broken through. The high point MA30 continues to oscillate and press down, indicating strong pressure at the high point on the 12-hour chart, with strong pressure near the 66200/3250 level. Personally, I expect the overall intraday trend to be biased towards oscillating upward movement today. For short-term intraday operations, it is recommended to continue focusing on long positions after pullbacks. Specific reference points are as follows:
Bitcoin: Long at 64500-64000, with a target of 66000.
Ethereum: Long near 3150-3120, with a target of 3240.
The above is my personal intraday market analysis, provided for reference only. For those who are uncertain about trend and entry points for future operations, you can follow "Public Number: Mu Feng Looks at Trends" for learning and discussion together!

免责声明:本文章仅代表作者个人观点,不代表本平台的立场和观点。本文章仅供信息分享,不构成对任何人的任何投资建议。用户与作者之间的任何争议,与本平台无关。如网页中刊载的文章或图片涉及侵权,请提供相关的权利证明和身份证明发送邮件到support@aicoin.com,本平台相关工作人员将会进行核查。


