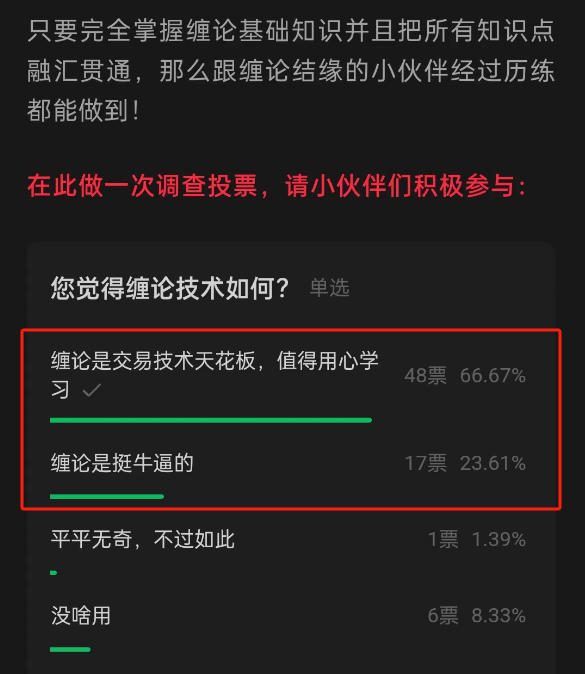
Yesterday, an interactive real-time public vote on the views of friends on the K-line theory was conducted in the article. As of now, the results of the vote show that 90% of the participants believe that the K-line theory is worth studying and think highly of it.
Bitcoin's fourth halving has entered the 24-hour countdown range and is expected to reach the block height and officially halve around 7 a.m. Beijing time tomorrow morning. We will once again witness history!
For many people in the coin circle, the most frequently heard phrase at the moment is: "The big cake has not halved, but the assets have already halved." However, there is no need to be discouraged. As long as you do not use high leverage, being trapped or assets halving is only temporary. As long as the daily level of the big cake confirms a third buy, everything will come back. How can you see the rainbow without experiencing the wind and rain!
For the coin circle, BTC halving is a major event for the entire coin circle and has an extremely important impact on the overall market. From the market after each halving, without exception, it reached the climax of the bull market at some point in the future after the halving! The last time the big cake halved was in May 2020 when the price was around 9500 points. In the end, the big cake reached the first peak of the previous bull market at 64850 points in April 21, and after experiencing a brief violent washout, it reached a new high of 69000 in the last bull market in November.
This time, the halving market of the big cake has a very different feature from the previous three times. Before this halving, under the blessing of Bitcoin spot ETF, the big cake had already broken through the historical high. So, with the formal halving and the upcoming interest rate cut and liquidity injection by the US, there are higher expectations and imaginations for the peak of the future bull market of the big cake.
Looking at the current market, after the big cake broke below 60000 points yesterday and rebounded, it did not continue to make new lows, but showed a very rare 30-minute single-section trend, with the highest rebounding to above 64000 points.
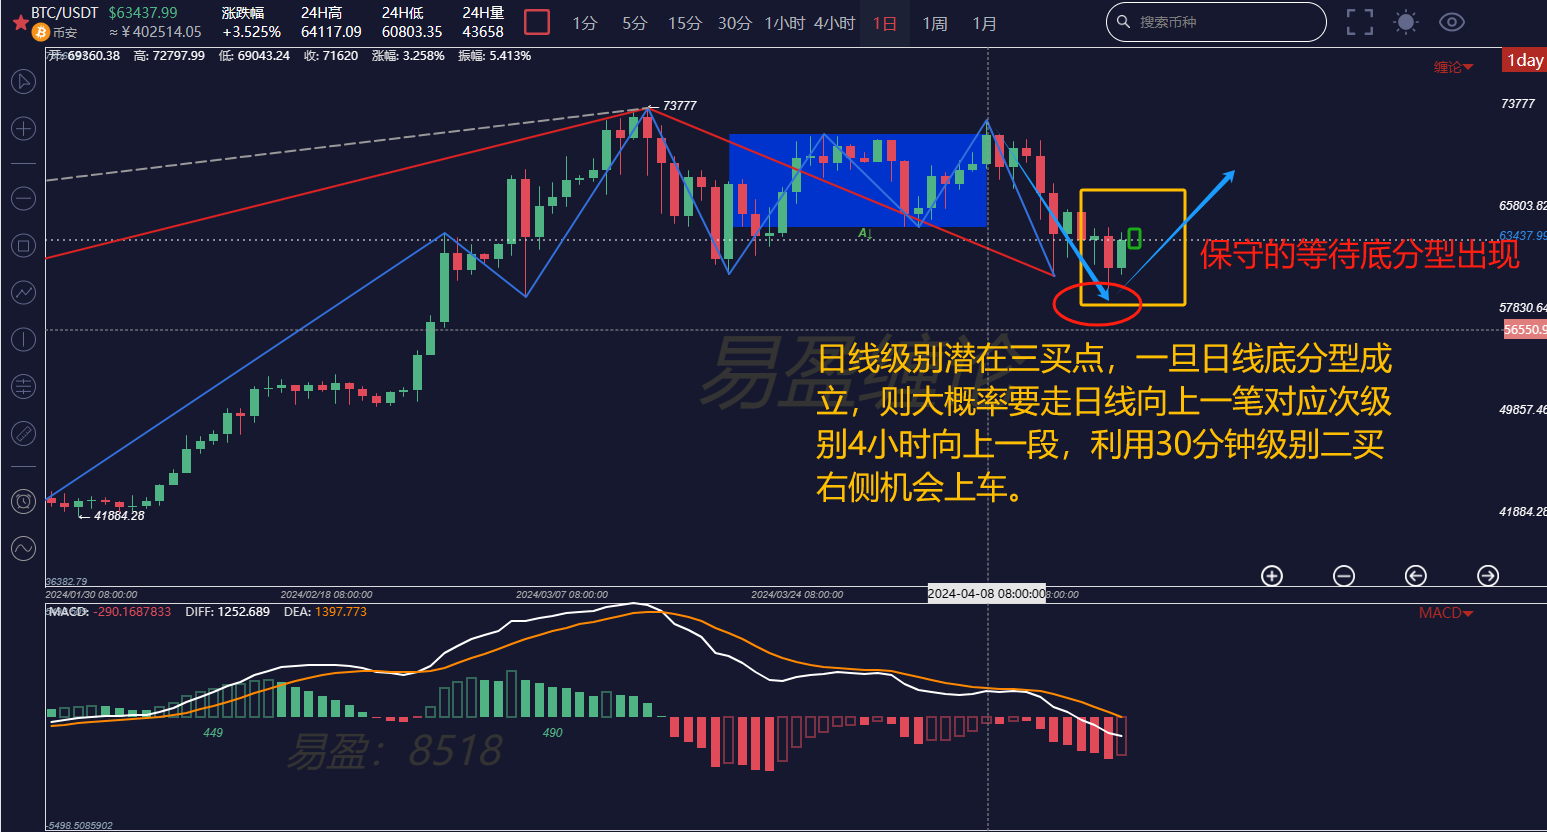
First, let's look at the daily chart. The daily level yesterday almost completely wrapped the previous day's bearish candle. Once a daily bottom fractal appears, it is highly likely to move up at the daily level, corresponding to the upward trend type at the 30-minute level. Once, as mentioned in yesterday's article, there is an opportunity for a 30-minute downward retracement without making a new low and confirming a second buy on the right side, it will be a relatively safe entry point.
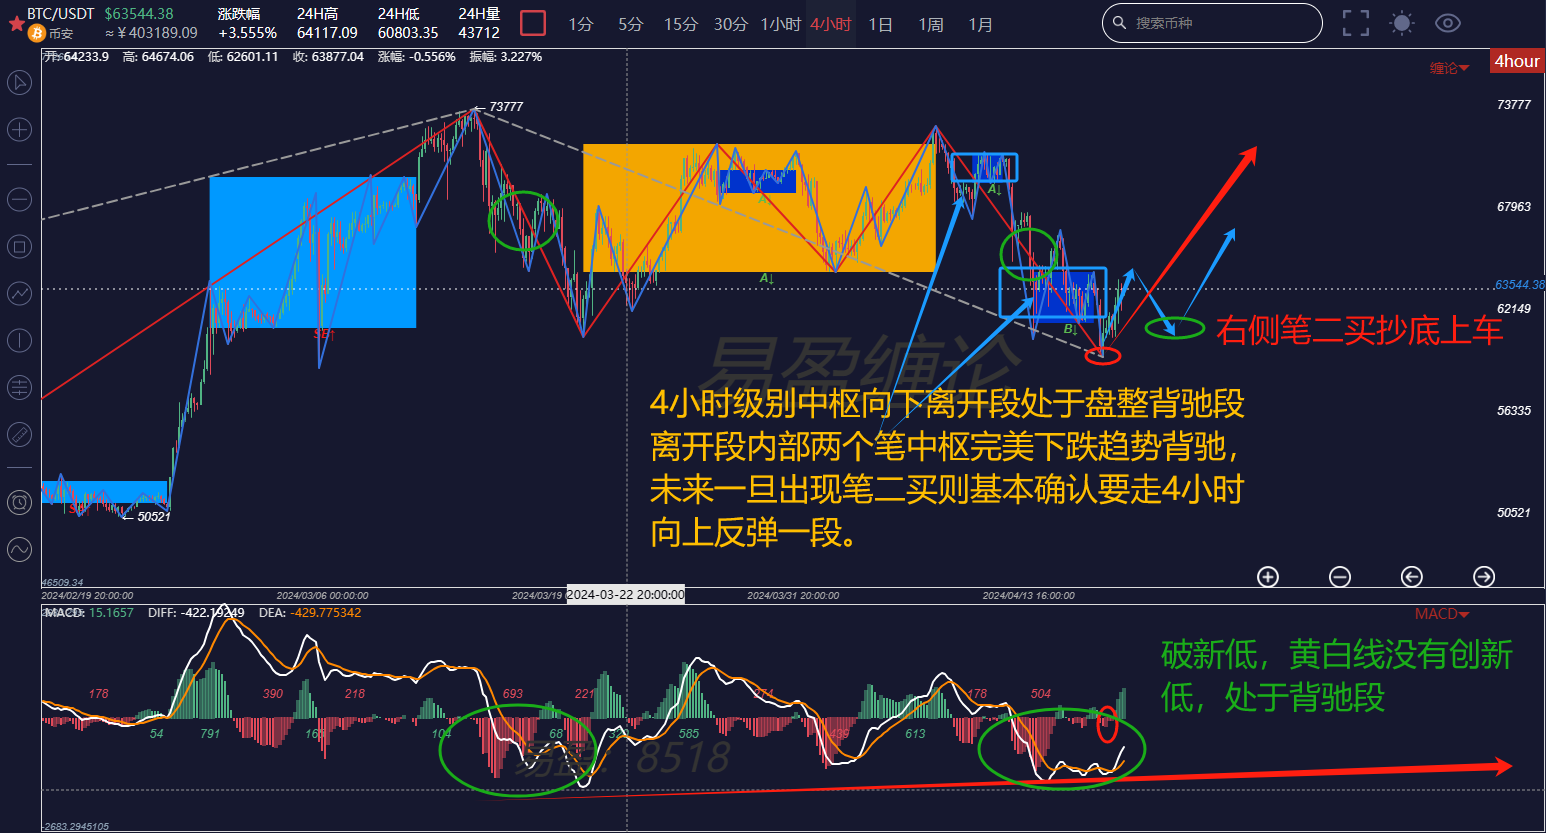
Next, looking at the 4-hour chart, it can be clearly seen that there is a new low breakthrough and consolidation divergence at the 4-hour level, leaving the downtrend with two pen centers and a complete and full structure. Once a second buy appears, it is safe to enter boldly, and it is expected to rebound at the 4-hour level.
If friends are interested in the K-line theory and want to obtain K-line learning materials for free, watch public live broadcasts, participate in offline K-line training camps, improve their trading skills with the K-line theory, build their own trading system to achieve stable profitability, and use K-line technology to timely escape the top and bottom, they can scan the following public account to chat privately and add the WeChat account to join the group for learning!

免责声明:本文章仅代表作者个人观点,不代表本平台的立场和观点。本文章仅供信息分享,不构成对任何人的任何投资建议。用户与作者之间的任何争议,与本平台无关。如网页中刊载的文章或图片涉及侵权,请提供相关的权利证明和身份证明发送邮件到support@aicoin.com,本平台相关工作人员将会进行核查。


