As early as March 22, it was warned that the US dollar index was facing a weekly level reversal, preventing another round of global harvesting. During this period, we have seen the collapse of Japanese government bonds, the collapse of the yen, and Japan facing another recession. A currency war has begun, and Asian currencies are facing a major storm. The yen is collapsing again, the South Korean won and the Indian rupee have hit new lows, and the offshore renminbi exchange rate has fallen by more than 200 points, with the US dollar holding at over 7.4.

Recently, it can be seen that the global investment market seems to have different degrees of impact. The US stock market has been falling for three consecutive weeks, and after gold hit a new high, it has also experienced a downturn in the past few days. The price of Bitcoin has been fluctuating at a high level for a month, falling to a low of 59678 last night and rebounding to 60600. Those who are cautious still need to wait and see.
Bitcoin
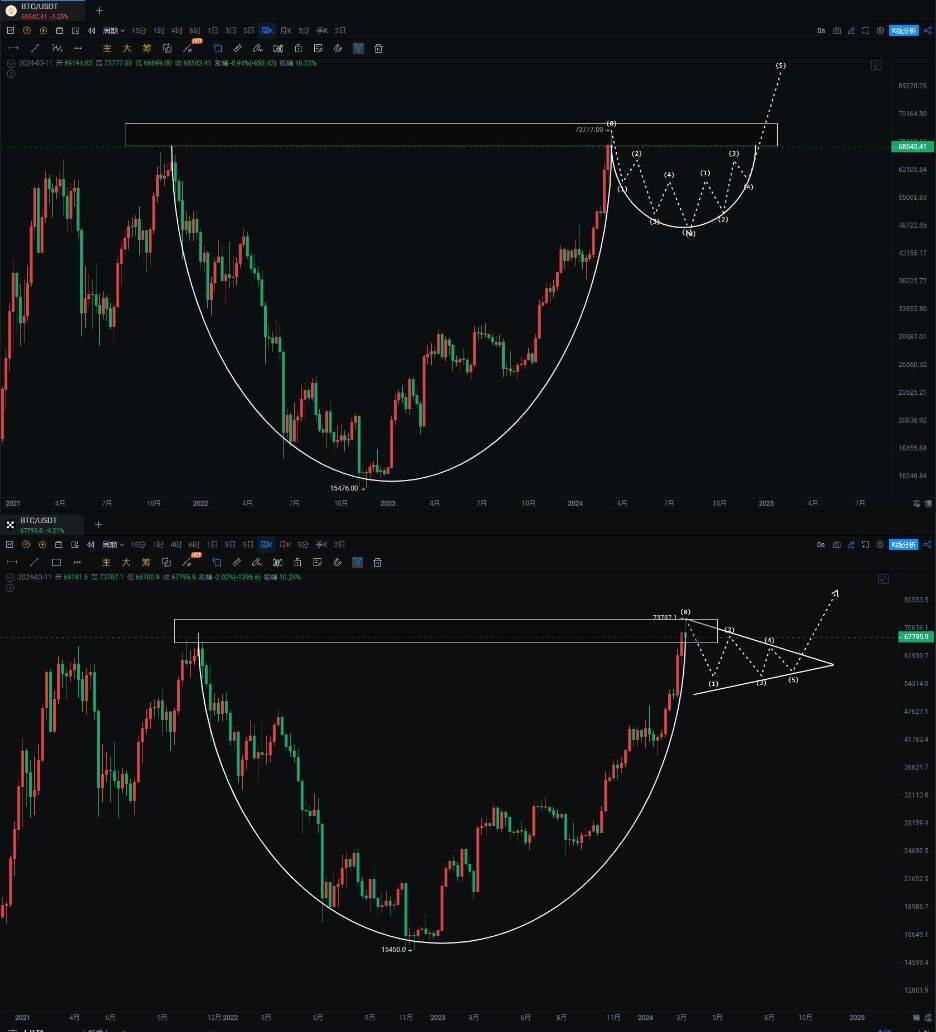
There are still 2 days left until the halving of Bitcoin. Bitcoin has been in a continuous downtrend. Although it is still within the range of 60600, the rebound on the market is too weak. Each rebound high has turned into resistance. The probability of falling to 53000-55000 has increased, and we are waiting for medium to long-term layout opportunities.
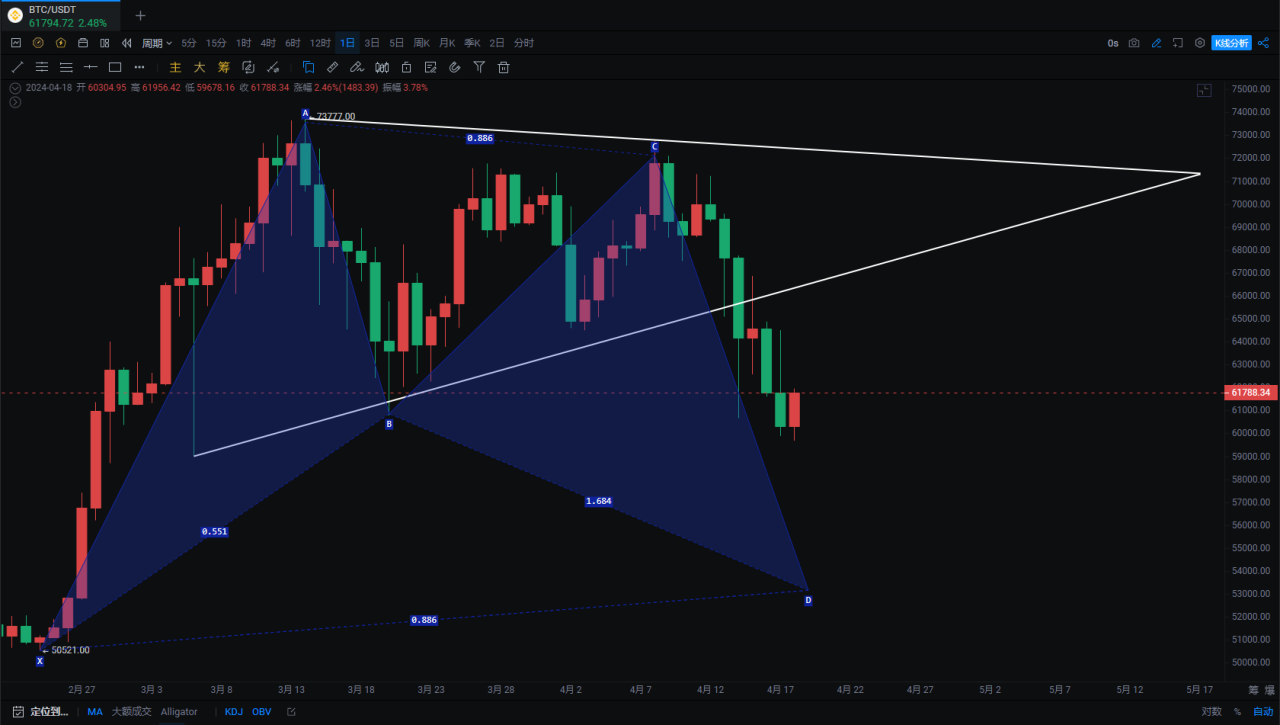
On the daily chart, it has fallen below the MA60 and continued to fall after touching the rebound yesterday. The MA60 and MA20 are facing a crossover, and the probability of falling to the MA120 has increased, which is also near the perfect bullish bat pattern we mentioned. The prevention is to not fall below 49000. The MACD fast and slow lines have crossed below the zero axis, and the OBV indicator's white line has fallen below the previous low. In the short term, there may be a rebound, after all, it fell below 60600 and then rebounded.
Support:
Resistance:
Ethereum
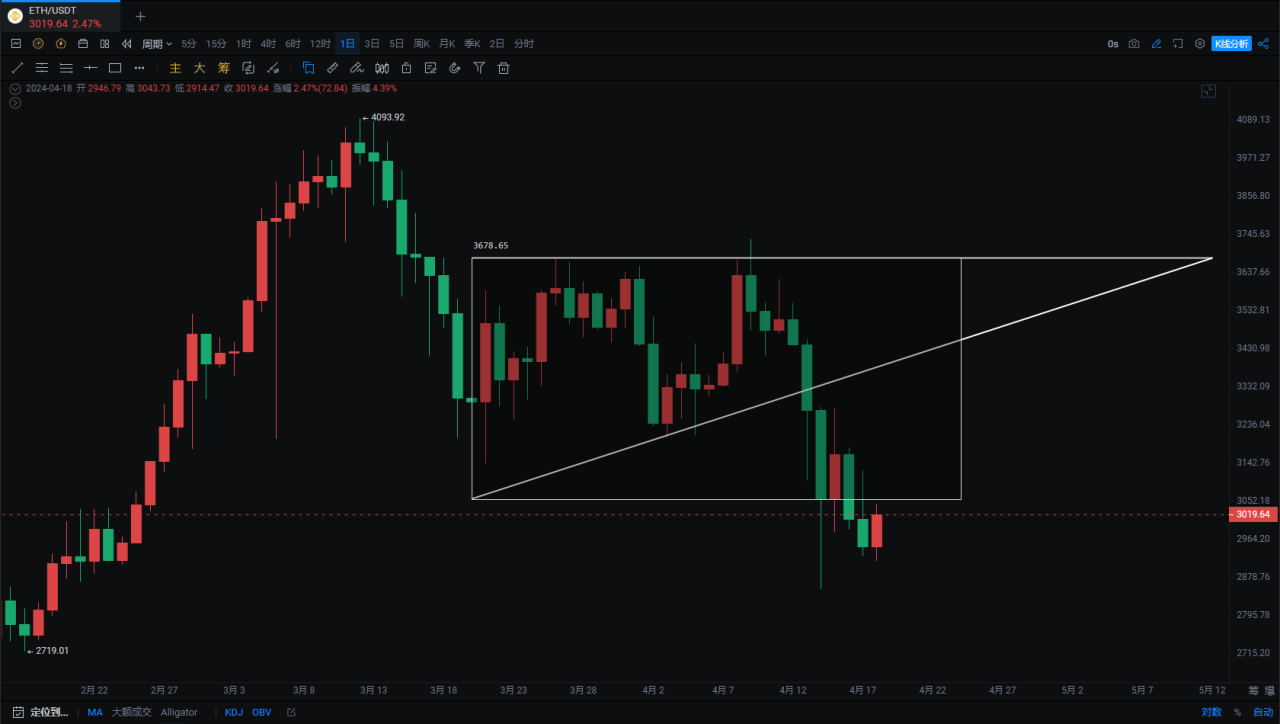
Ethereum did not hit a new low, but the previous mentioned bottom of 3056 has temporarily not held. On the day when the daily chart fell to 2852 and the following three days formed a double negative sandwiched by positive candles, the risk of a downturn at a high level was relieved. If Bitcoin falls to 53000-55000, Ethereum will fall to the support near the Fibonacci 0.618, and then fall below to 0.786 (2580). The ETH/BTC exchange rate will fall to 0.046, hitting a new low for half a year. If Bitcoin and Ethereum continue to fall, the altcoins will plummet, and blood will flow. Those that are temporarily weak will fall by 50-70%, basically reverting to their original state.
Support:
Resistance:
If you like my views, please like, comment, and share. Let's go through the bull and bear markets together!!!
The article is time-sensitive and is for reference only, with real-time updates.
Focus on candlestick technical research, win-win global investment opportunities. WeChat public account: 交易公子扶苏

免责声明:本文章仅代表作者个人观点,不代表本平台的立场和观点。本文章仅供信息分享,不构成对任何人的任何投资建议。用户与作者之间的任何争议,与本平台无关。如网页中刊载的文章或图片涉及侵权,请提供相关的权利证明和身份证明发送邮件到support@aicoin.com,本平台相关工作人员将会进行核查。