
The US dollar index has rebounded continuously and is currently at 106.3491, about 1 dollar away from the phase high of 107.3469. If the short-term rebound fails to break through 107.3469, it will open the way for a three-wave surge towards 114, making the global economy even worse.

The Dow Jones Industrial Average has fallen for three consecutive weeks. We have previously mentioned the false breakthrough on the daily chart, and after breaking the previous high, it pulled back for a long time, especially the hype around AI artificial intelligence such as Nvidia, which was very hot. The subsequent rise has become increasingly slow. There is a greater opportunity near the previous high for a pullback. The Nasdaq has already shown a false breakthrough, and there is still room for a decline in the S&P 500. In short, if the US dollar index rises, it will not bode well for the global investment market, including Bitcoin.
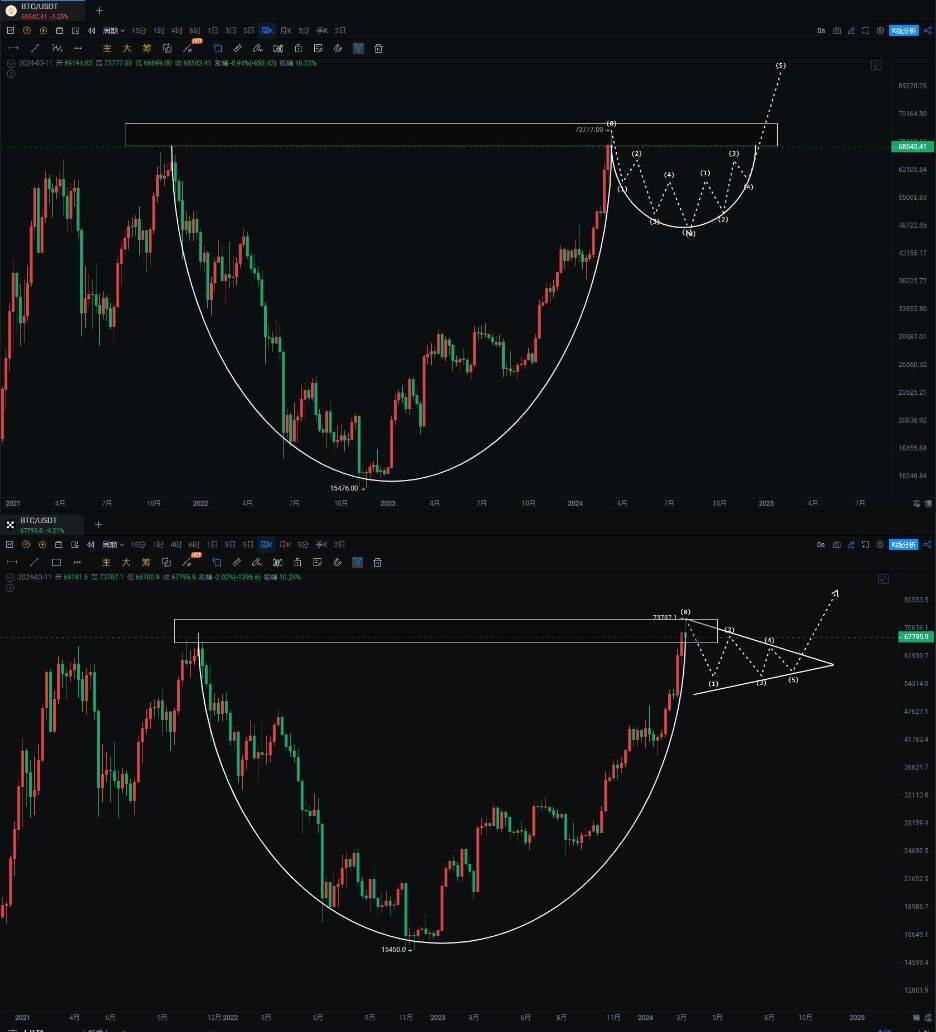
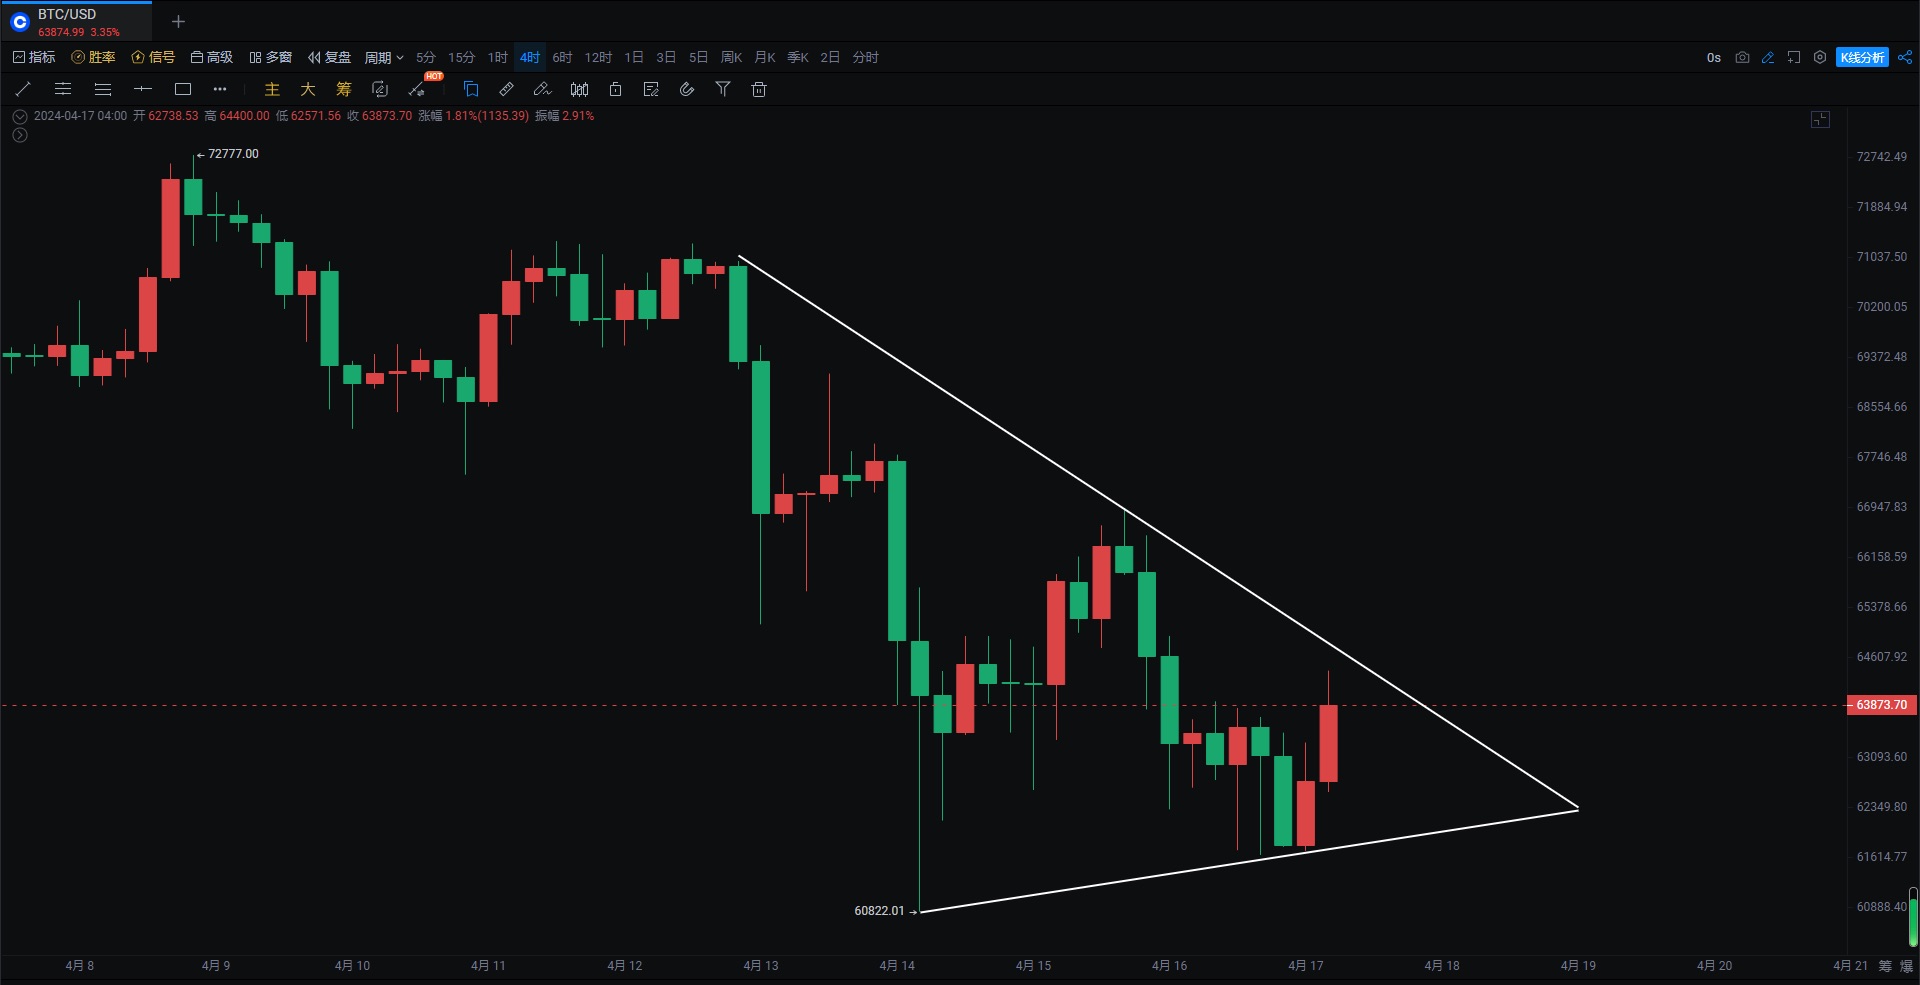
Bitcoin
A potential W-bottom trend has appeared on the 4-hour chart with a bullish divergence. It is currently suppressed by the MA20. If it can break through, there is a chance to see 68200. If it can reclaim the level above 68200, there is a chance to continue the large range oscillation between 60600 and 72000. The downtrend remains unchanged if the rebound fails to hold.
Rebound is once again suppressed by the middle track of the BOLL on the 4-hour chart. The candlestick on the daily chart fell below the MA60 yesterday. In order to turn bullish, it must reclaim 66867 in the short term to eliminate the risk of further decline.
Support:
Resistance:
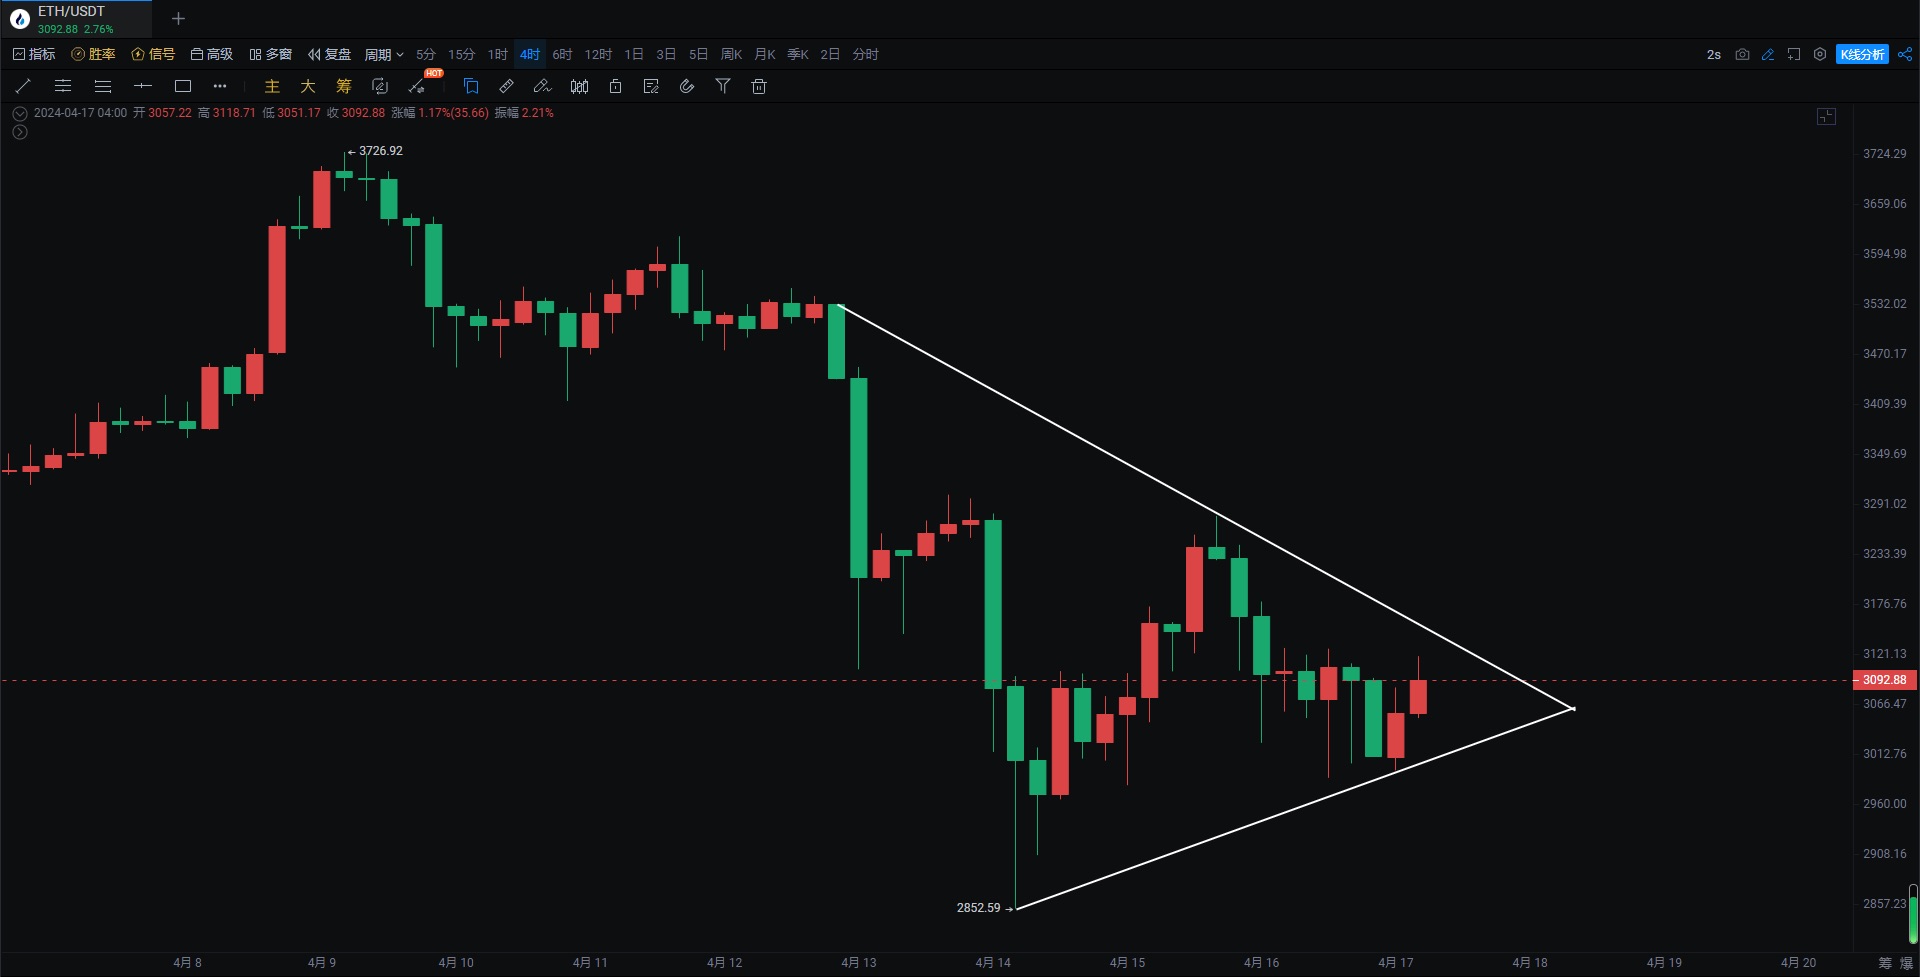
Ethereum
The current price is still near the previous low of 3056, with the lowest touching 2852 (BN). A bullish divergence appeared on the 1-hour chart, and it remains to be seen if it will continue to the 4-hour chart. Small-scale bullish divergences can only be observed for a few hours and the strength of the rebound needs to be assessed. Similarly, the 4-hour chart is suppressed by the BOLL middle track. If it breaks through, there is a chance to form a W-bottom and then look at the resistance of the 4-hour downtrend line. The temporary rebound can only be seen as a short-term rebound for now, and the phased bottom-fishing plan we previously mentioned can be held onto.
Support:
Resistance:
If you like my views, please like, comment, and share. Let's go through the bull and bear markets together!!!
The article is time-sensitive and is for reference only, with real-time updates.
Focus on candlestick technical research, and win-win global investment opportunities. Official account: Trading Master Fusu

免责声明:本文章仅代表作者个人观点,不代表本平台的立场和观点。本文章仅供信息分享,不构成对任何人的任何投资建议。用户与作者之间的任何争议,与本平台无关。如网页中刊载的文章或图片涉及侵权,请提供相关的权利证明和身份证明发送邮件到support@aicoin.com,本平台相关工作人员将会进行核查。


