Morning market trends may go how? Little A explains for you!
Welcome to the group chat to ask Little A for more analysis: https://jv.mp/JaQ0CE
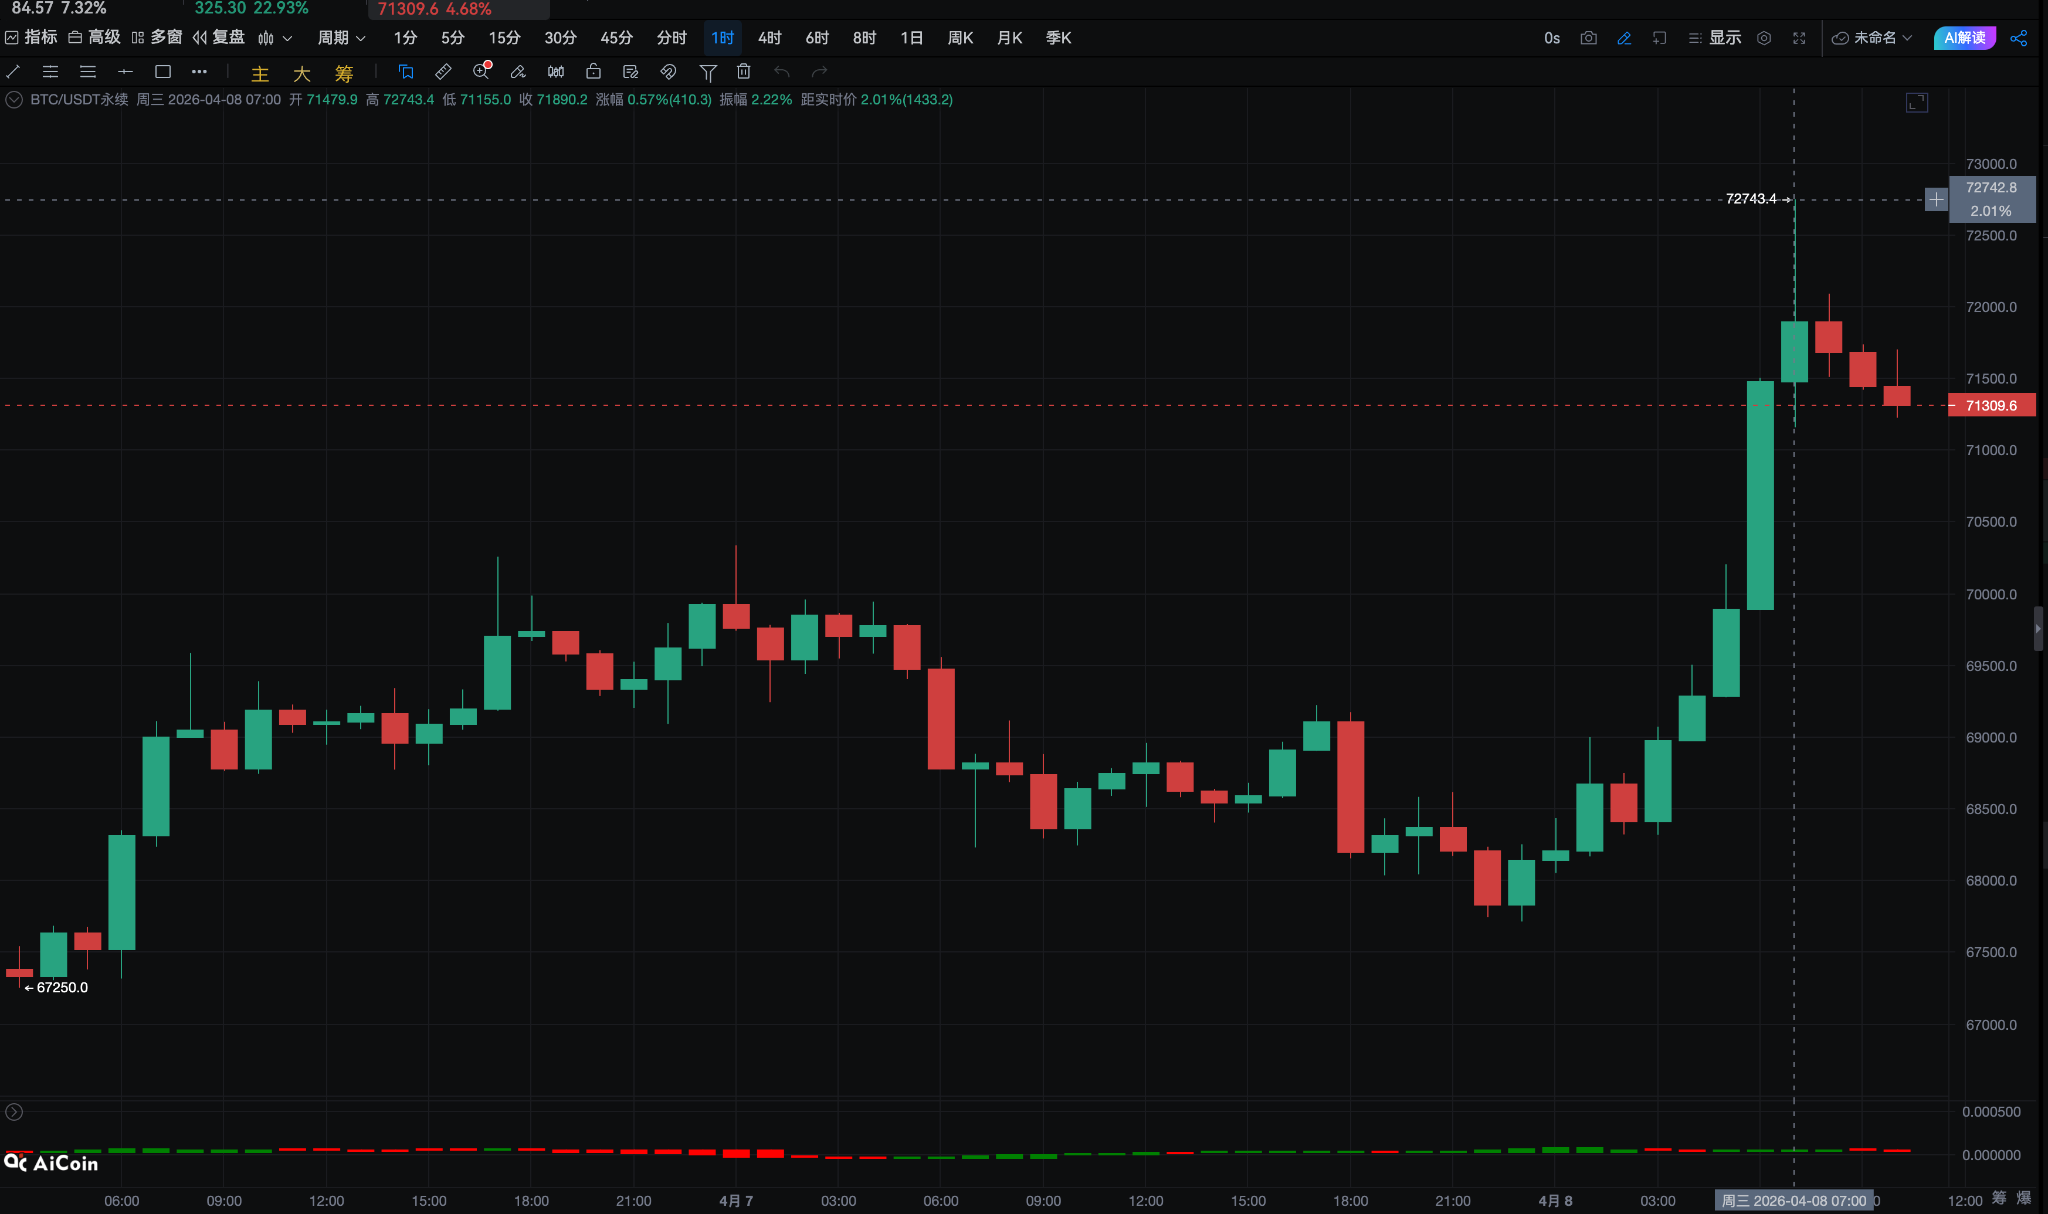
BTC
BTC's 1-hour price trend: Up.

This is a 1-hour Binance BTC/USDT K-line chart, with the latest price at: 63675.7 USDT, including EMA, MACD, KDJ, and volume indicators.
【Buy/Sell Points】
Buy point one: 63000 USDT (EMA(7) crosses above EMA(30), KDJ indicator shows both K-line and D-line maintaining an upward trend, indicating a possible continued short-term bullish trend)
Buy point two: 61500 USDT (recent appearance of long lower shadow candlestick providing support, and this price range is near the lowest price area, with potential strong support)
Long position stop loss point: 61000 USDT (enough space left to avoid triggering stop loss due to minor fluctuations, while considering the support near 61500 USDT)
Sell point one: 65000 USDT (close to previous high and potential resistance, suitable as an initial profit-taking point)
Sell point two: 66000 USDT (if it breaks through the 65000 USDT resistance, it may test higher resistance levels, and 66000 USDT was a high point in past trading days)
Short position stop loss point: 66500 USDT (provides additional space to cope with adverse fluctuations beyond sell point two, while this position is near historical high points, shorting carries higher risk)
【Price Trend Analysis】
Candlestick pattern:
- Recent candlesticks show significant price fluctuations, with several long lower shadow candlesticks (such as 18:00 on April 16), indicating buying interest at lower levels to support prices. There are also some candlesticks with relatively balanced small real bodies and upper and lower shadows, suggesting market indecision.
- At specific times (such as 17:00 on April 15), a long upper shadow candlestick appeared, indicating heavy selling pressure at higher levels, pushing prices up and then being sold off.
Technical indicators:
- In the MACD indicator, the DIF and DEA values are negative in the latest data, and the MACD histogram shows a shrinking trend, indicating a weakening bearish momentum in the short term, but reversal signals still need to be watched.
- In the KDJ indicator, the J value is near 85, slightly overbought, but the K-line and D-line still maintain an upward trend without crossing, indicating a possible continued bullish trend in the short term.
- In the EMA indicator, EMA(7) has crossed above EMA(30) and is trending upward, indicating a short-term positive trend, but considering that EMA(30) is still below, the medium to long-term trend has not been confirmed.
Volume:
- Volume expanded at specific times (such as 18:00 on April 16), accompanying price declines and rebounds, possibly signaling a reversal.
- Overall, volume expands as prices rise and contracts as prices fall, conforming to the normal relationship between price and volume.
ETH
ETH's 1-hour price trend: Sideways.

This is a 1-hour Binance ETH/USDT K-line chart, with the latest price at: 3081.62 USDT, including EMA, MACD, KDJ, and volume indicators.
【Buy/Sell Points】
Buy point one: 3100 USDT (recently touched multiple times with signs of rebound, can be considered a short-term support level)
Buy point two: 3050 USDT (long lower shadow appeared at 12:00 on April 16, indicating strong buying support in this price range)
Long position stop loss point: 3020 USDT (below buy point two, with enough space left to avoid triggering due to minor fluctuations)
Sell point one: 3150 USDT (between EMA(7) and EMA(30), potential resistance may exist)
Sell point two: 3200 USDT (close to the high point at 19:00 on April 15, if unable to break through, it may form a double top)
Short position stop loss point: 3230 USDT (above sell point two, providing adequate space to cope with adverse fluctuations)
【Price Trend Analysis】
Candlestick pattern:
- Recent candlesticks show significant price fluctuations, with multiple long lower shadow candlesticks (such as 12:00 on April 16, 23:00 on April 15), indicating buying interest at lower levels, but upward pressure still exists.
- A long upper shadow candlestick appeared at 19:00 on April 15, followed by a price decline, possibly a short-term top signal.
Technical indicators:
- MACD indicator: The latest MACD value is positive, DIF and DEA are both negative and DIF is above DEA, suggesting a possible rebound trend in the near term, but overall still in bearish territory.
- KDJ indicator: The J value is higher than K and D values, and all three are above 50, indicating the market may be overheated, and caution is needed against pullback risk.
- EMA indicator: EMA(7) is below EMA(30), although the gap between the two has narrowed, the downward trend has not been completely reversed in the short term.
Volume:
- Volume expands during significant price fluctuations (such as 18:00 on April 16, 14:00 on April 15), indicating these price points may be key support or resistance levels.
- Volume has been relatively stable in the past few hours, with no significant increase, indicating the market may be searching for direction.
NMT
NMT's 1-hour price trend: Sideways.

This is a 1-hour Gate NMT/USDT K-line chart, with the latest price at: 0.011452 USDT, including EMA, MACD, KDJ, and volume indicators.
【Buy/Sell Points】
Buy point one: 0.0115 USDT (Considering the narrowing gap between EMA(7) and EMA(30), if the price can stabilize above this level, it may indicate the potential for a short-term upward trend reversal)
Buy point two: 0.0110 USDT (This is the recent low point, if the price retraces to this level and does not further decline, it can be considered a strong support level, suitable as a more conservative buying point)
Long position stop loss point: 0.0108 USDT (Leave enough space to avoid triggering stop loss due to minor fluctuations, and this price is below buy point two, below the recent low point, a break below may confirm a downward trend)
Sell point one: 0.0120 USDT (The current market sentiment is unclear, choosing a position close to the recent high points in the past few hours as an initial sell point to ensure substantial profits)
Sell point two: 0.0124 USDT (Close to the high point at 06:00 on April 16, if the price can break through this resistance level, it may attract more buyers to push the price higher)
Short position stop loss point: 0.0126 USDT (Exceeds sell point two, providing additional space to cope with potential price increases, reaching this level may indicate the establishment of an upward trend)
Price Trend Analysis
Candlestick pattern:
- Recent candlesticks show significant price fluctuations, especially with a long upper shadow candlestick at 19:00 on April 15, indicating some selling pressure in the market. Between 05:00 and 06:00 on April 16, the price retraced slightly, forming a short real body and a relatively long lower shadow, suggesting buyer intervention.
- In the past few hours, the candlestick bodies are small, and the opening and closing prices are close, indicating that the current market is in a relatively balanced state.
Technical indicators:
- In the MACD indicator, the DIF is below the DEA, and the MACD value is negative, which is usually considered a bearish signal. However, the small difference between DIF and DEA indicates the potential for a trend reversal.
- In the KDJ indicator, the J value in the latest data point is higher than the K and D values, but overall, all three are in the low range, suggesting oversold conditions in the market and the possibility of a rebound.
- The EMA indicator shows the 7-period EMA below the 30-period EMA, which usually indicates a short-term downward trend, but the gap between the two is narrowing, possibly indicating a future trend change.
Volume:
- The volume peaked at 18:00 on April 15 and gradually decreased, which may be related to the significant price fluctuations at that time. Subsequently, the volume stabilized and slightly decreased, consistent with a stabilizing price trend.
- The volume in the past few hours is relatively low, indicating low market activity, possibly needing more triggering factors to guide the market direction.
※All content is provided by the intelligent analysis assistant Little A, and is for reference only, not constituting any investment advice!
Little A Intelligent Analysis is the industry's first intelligent analysis tool recommended by AICoin, which easily helps you interpret the trend of currencies, analyze indicator signals, and identify entry and exit points. You can experience it on the APP or PC.
Download for PC: https://www.aicoin.com/en/download
Download the APP: https://aicoin.app/download
免责声明:本文章仅代表作者个人观点,不代表本平台的立场和观点。本文章仅供信息分享,不构成对任何人的任何投资建议。用户与作者之间的任何争议,与本平台无关。如网页中刊载的文章或图片涉及侵权,请提供相关的权利证明和身份证明发送邮件到support@aicoin.com,本平台相关工作人员将会进行核查。