
First of all, I have always been bullish, but the current position has more risks than opportunities. In the short term, Bitcoin seems to rebound around 70,000, but it has been unable to break through the pressure below. On April 8th, I reminded that the BTC halving countdown is 12 days, and it is under pressure below the converging triangle. I reduced my position and waited for the opportunity to bottom fish. On April 10th, I reminded that BTC's converging triangle breakout is false, and the risk continues to increase before the halving. Are we waiting for medium to long-term layout opportunities? I also reminded to fill the gap at 68,000-69,000. The lowest price touched 67,518, and rebounded to 71,305 under pressure.
Ethereum's rebound is even weaker. Friends who often follow Fusuo's analysis should have seen the breakout above 3,678 as bullish, and can only look bearish below. The longer the time and space for the pullback, the more unfavorable it becomes. As long as it cannot break through this price for a day, the potential C-wave decline is unavoidable.
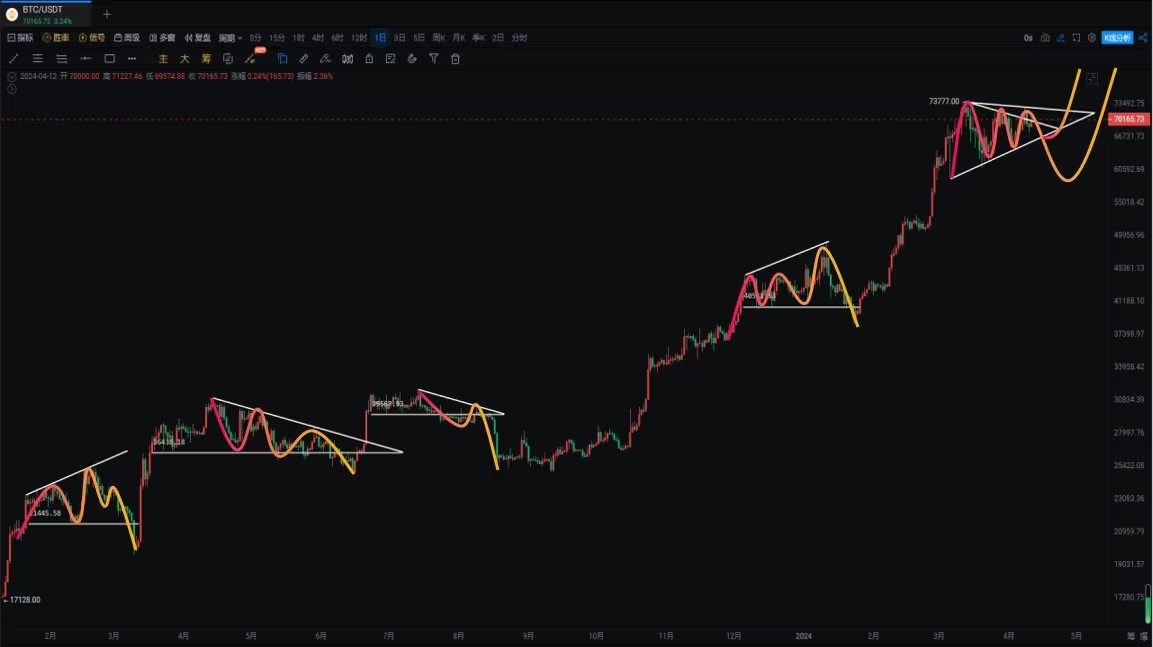
The U.S. dollar index is playing tricks, as we have also verified. After BTC's strong rebound on March 22nd, there is a potential head and shoulders bottom pattern on the 4-hour chart. The U.S. dollar index is facing a turning point and still needs to be cautious! At that time, the dollar was still at 103, now it is at a high of 106. Looking back at history, in September 2022, it peaked at 114.78, and started to decline in November. Bitcoin bottomed and rebounded in November 2022. In February, May, and July, the dollar rose while Bitcoin fell. You can refer to "The negative correlation between Bitcoin and the US Dollar Index (DXY) reaches a 17-month high. Can you see some investment rules?" Will this correlation decrease in the bull market? Let's wait and see.
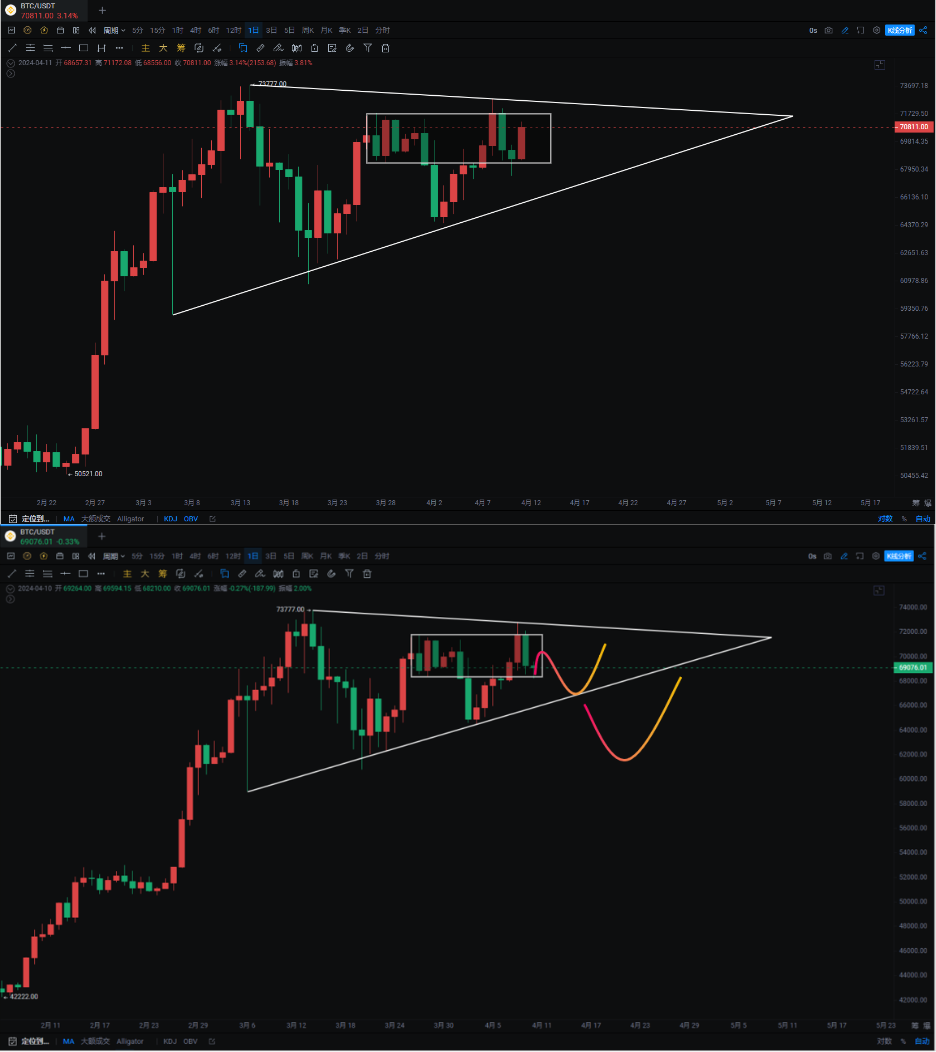
Bitcoin After piercing through 72,756, it showed a strong sell signal. After filling the gap, it rebounded for two consecutive days to 71,287 but was resisted. The daily chart has been oscillating above the BOLL, and if it falls below the midline, the risk is doubled. The price line is still above the MA20, and the MACD is diverging at the bottom but has not effectively formed so far. The OBV indicator's yellow line turned down and the white line crossed above the yellow line.
On the 4-hour chart, it is still oscillating within the range of 68,200-71,769. Pay attention to the price changes within this range. The resistance above is within reach. It's a matter of minutes for large funds to break through 73,777 by 1,000-2,000. Dialectical thinking is needed. The probability of a converging or expanding triangle appearing at a phase top and pulling back is high. Refer to the routine of the previous year, it quickly recovers after breaking through.
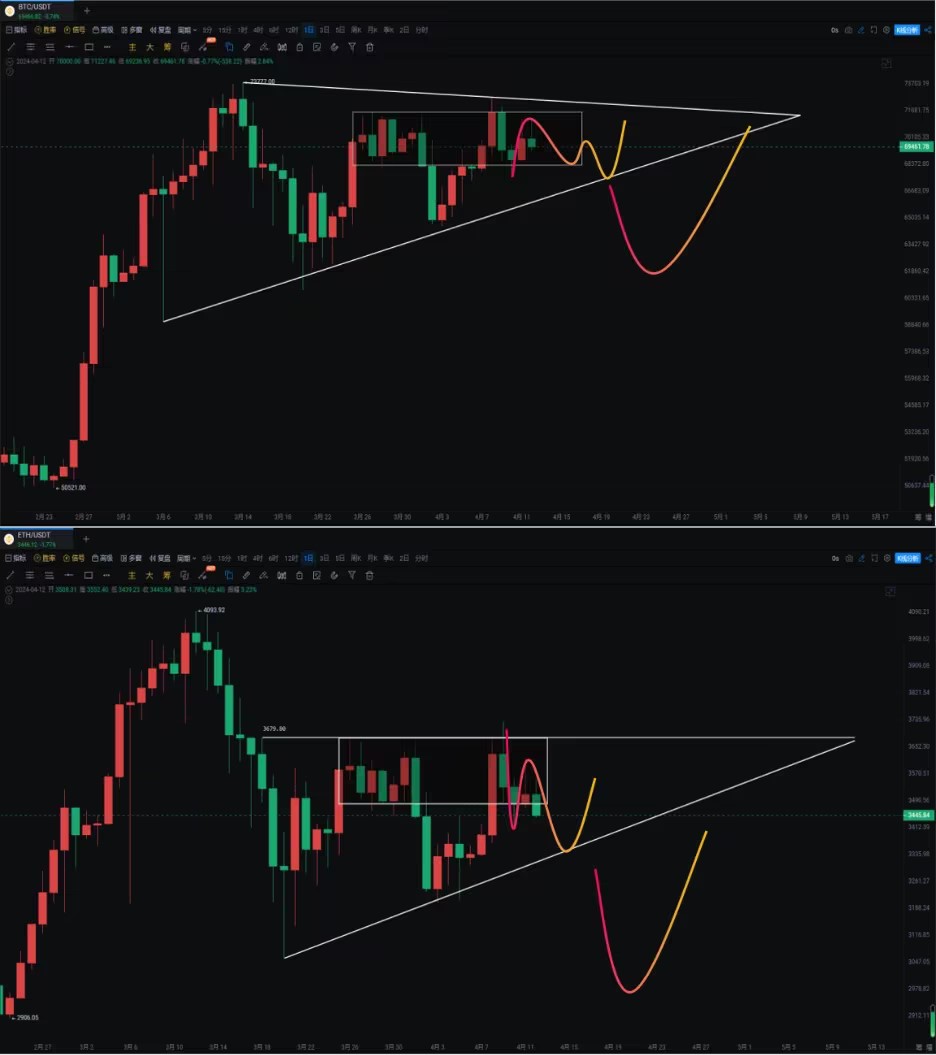
Ethereum It has a descending triangle pattern, and it cannot be ruled out that BTC is brewing a larger pullback. The daily MACD is diverging at the bottom, and the OBV has been suppressed by the yellow line, with continuous outflows of funds.
The ETH/BTC exchange rate rebounded from 0.048 to 0.052 and then fell back, and will once again test the support at the bottom of the previous days.
If you like my views, please like, comment, and share. Let's go through the bull and bear markets together!!!
The article is time-sensitive and is for reference only, with real-time updates.
Focus on candlestick technical research, and win-win global investment opportunities. Official account: Trading Master Fusuo

免责声明:本文章仅代表作者个人观点,不代表本平台的立场和观点。本文章仅供信息分享,不构成对任何人的任何投资建议。用户与作者之间的任何争议,与本平台无关。如网页中刊载的文章或图片涉及侵权,请提供相关的权利证明和身份证明发送邮件到support@aicoin.com,本平台相关工作人员将会进行核查。


