As a senior figure in the cryptocurrency circle, I have always been committed to providing helpful advice to everyone, hoping to help you avoid detours and mistakes in this market. Although I have been earnestly advising, the path of investment still needs to be explored by oneself. Learning is endless, and the experience gained is the real wealth!
Here, I wish my fans to achieve financial freedom in 2024. Let's cheer together!
Cryptocurrency Academician: Bitcoin (BTC) Latest Market Analysis Reference for April 11, 2024
Bitcoin's performance in the latter part of yesterday can be said to have a very good trend of washing out. Looking back at yesterday's market, the train of thought I shared with everyone in my circle of friends was to aim for over 68500 and target 69500, capturing a real-time gain of 1000 points. At that time, the market had already reached 69500. Why didn't I choose to go short with the trend? It's because the indicators in the market at that time were not very clear. In order to be more cautious, I missed the opportunity to go short. After that, I could only wait for a pullback to establish a long position. Finally, I positioned a long at the ultimate point of 67800 as I mentioned, with a target of 70500, and successfully gained 2700 points. So, how should we position ourselves in today's market? Let's continue reading.

As of the time of writing, Bitcoin is trading near 70700. From the overall trend of the market, this position is relatively high. The risk of going long at the upper end is slightly greater, so it is not recommended to chase long positions for the time being. Short-term selling is the main strategy because the daily K-line has just opened for a short time, and yesterday's idle trading closed with a bullish trend. However, the overall trend seems to have partially recovered from the bullish side, but in reality, there is significant resistance at the upper end. Therefore, unless the pressure zone between 71500 and 72000 is broken, the bulls will not open positions.
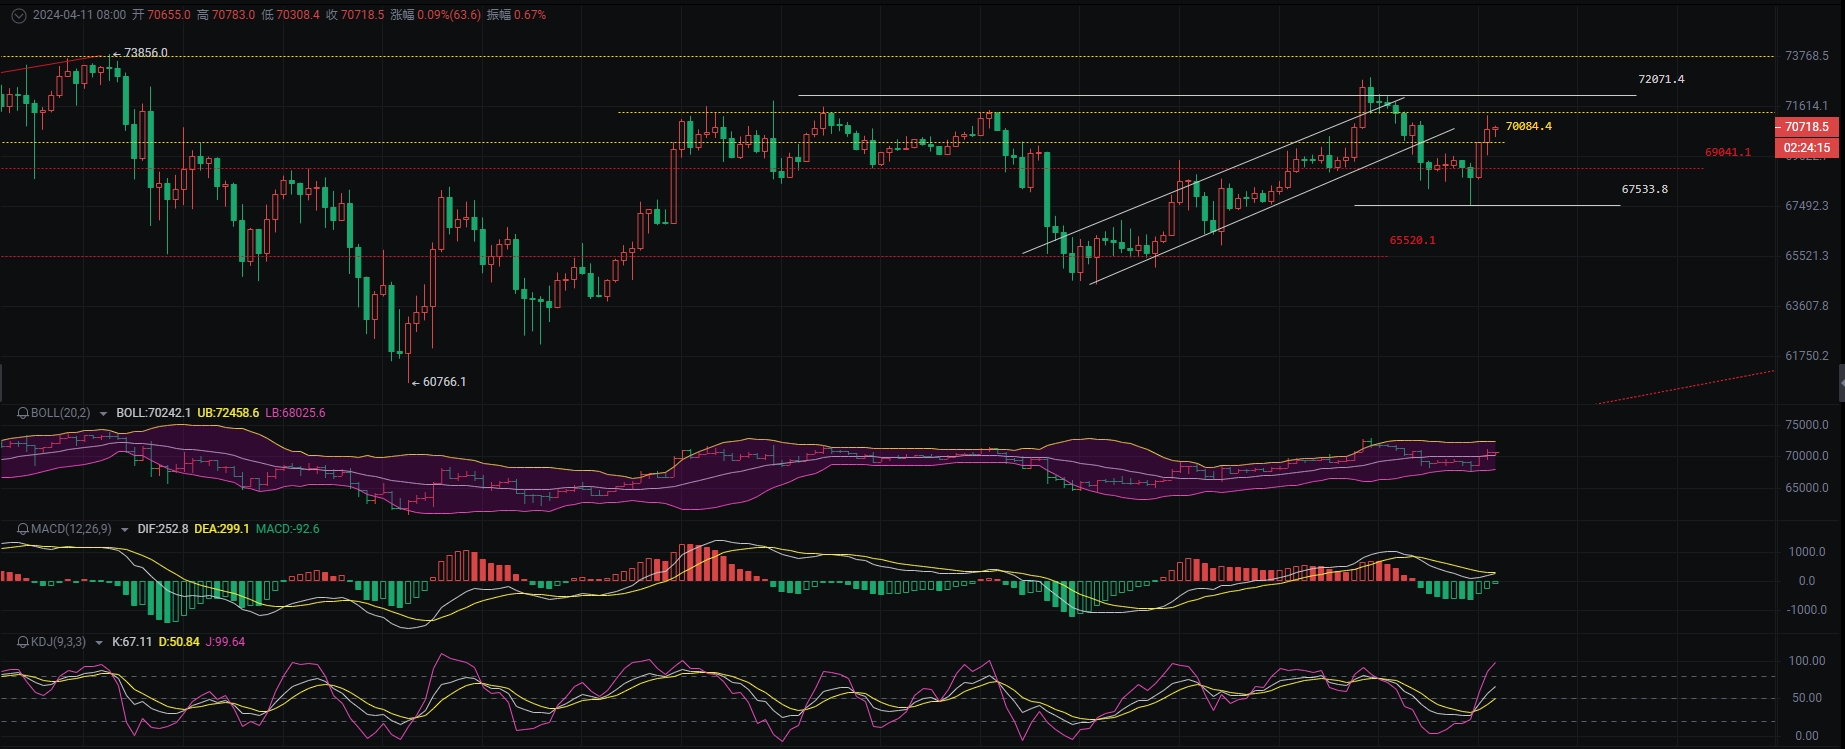
Currently, the EMA trend indicators are similar to before, stretching upwards. EMA10 has risen to 69600, and with yesterday's pullback support at EMA30 at 67700, the trend of pulling back to 67700 today is not significant. However, there is still profit potential for short positions. KDJ is blocked at a value of 77.74, and the MACD is shrinking with an upward trend. DIF and DEA are closing at a high level. Currently, the main force has been continuously increasing positions. Therefore, while we are shorting, we must set a good stop-loss position. This way, even if the market breaks through and stretches, we won't miss the opportunity to follow the trend. The overall trend of the Bollinger Bands is starting to converge, with all three bands moving upward. The support at the lower end has reached 69000, and the pressure at the upper end is at 73000.
Looking at the ultra-short trend on the four-hour chart, the U-shaped pattern of the K-line has reached a high point, and the previous four-hour K-line closed with a long shadow both above and below. In addition, the EMA trend indicator has returned to a bullish trend, but the momentum is not as strong as before. Since there are only two alternating indicators, it is expected that the K-line will experience a pullback. After all, the current K-line is somewhat overextended from the trend indicators. KDJ has stretched upwards to a maximum value of over 97, and the MACD is shrinking with an increase in positions, with DIF and DEA closing at a high level. The Bollinger Bands are moving upward, and the K-line is expected to pull back to the middle track at 70300, with the upper pressure point at 72500. Although various indicators seem to show a strong bullish trend, in reality, they have all reached a dense pressure point. Therefore, overall, it is advisable to focus on short positions for the time being and wait to establish long positions at lower levels for a more secure approach.
Specific reference for positioning:
First entry point for long positions: 69000, second entry point: 68000, stop-loss point for long positions: 67500
First entry point for short positions: 71000, second entry point: 72000, stop-loss point for short positions: 73000
(Each point has a range, so the positioning can be determined based on changes in the market. Positioning in the range of 69000 and 68000 is feasible) (The same principle applies to short positions. When the market surpasses the range of 71000 to 72500, you can find a position to go short. Without specific guidance, you can make your own decisions, but avoid being greedy.) Specific operations should be based on real-time market data. For more information, please consult the author. The article is published with a delay and is recommended for reference only. Trade at your own risk.
This article is exclusively provided by the Cryptocurrency Academician and represents the Academician's exclusive viewpoint. The viewpoints and suggestions for BTC, ETH, DOGE, DOT, FIL, EOS, and others are based on in-depth research. Due to the timing of article publication, the above viewpoints and suggestions are not real-time and are for reference only. Trade at your own risk. Please indicate the source when reposting, and manage your positions reasonably. Do not overexpose or fully expose your positions. The Academician also hopes that all investors understand that the market is always right. If you make a mistake, you should reflect on your own problems and not let the potential profit slip away. There is no need to be smarter than the market in investment. When the trend comes, you should follow it; when there is no trend, you should observe and wait. After the trend becomes clear, it is not too late to take action. Tomorrow's success comes from today's choices. The universe rewards hard work, the earth rewards kindness, people reward sincerity, business rewards trust, industry rewards excellence, and art rewards passion. Gains and losses are both incidental. Develop the habit of strictly setting stop-loss and take-profit levels for each trade. The Cryptocurrency Academician wishes you a pleasant investment experience!

Friendly reminder: The content above is created by the author's public account. The advertisements at the end of the article and in the comments section are not related to the author. Please discern carefully, and thank you for reading.
免责声明:本文章仅代表作者个人观点,不代表本平台的立场和观点。本文章仅供信息分享,不构成对任何人的任何投资建议。用户与作者之间的任何争议,与本平台无关。如网页中刊载的文章或图片涉及侵权,请提供相关的权利证明和身份证明发送邮件到support@aicoin.com,本平台相关工作人员将会进行核查。


