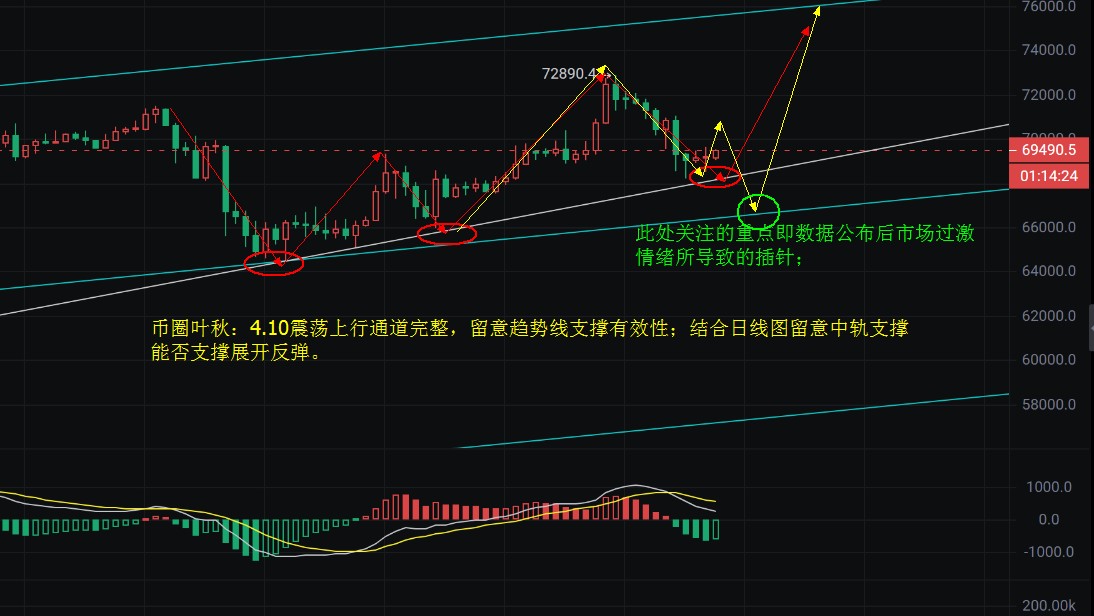
Yesterday, there was a overall retracement and downward trend, breaking through the daily moving average, and falling again in the evening to around 71000, breaking through to near the midline at 68400, and stabilizing to initiate a rebound. The daily closing was below the 5-day moving average at 69700 and above the midline. For the daily chart, the back and forth movement around the midline is a means of shaking out weak positions. As early as last week, I mentioned that "narrow fluctuations in the daily chart are inevitable." If the daily chart rises to 72800 and then retreats to a negative trend, it achieves the purpose of shaking out weak positions, while whale addresses are gradually absorbing chips. Perhaps this will be the last time the bulls gather strength, or perhaps the market is testing the sentiment of small retail investors near the 70,000 mark. Personally, I believe that the probability of a major player shaking out positions is high, because the rhythm of the upward oscillation in the longer term has not completely reversed. Although there is a divergence in the weekly chart, it is nothing more than the selling phenomenon brought about by some panic sentiment. As for the future, whether it will rise to refresh the high point of 78000 or 84000, further attention needs to be paid to the variables brought about by the trend of the daily chart.
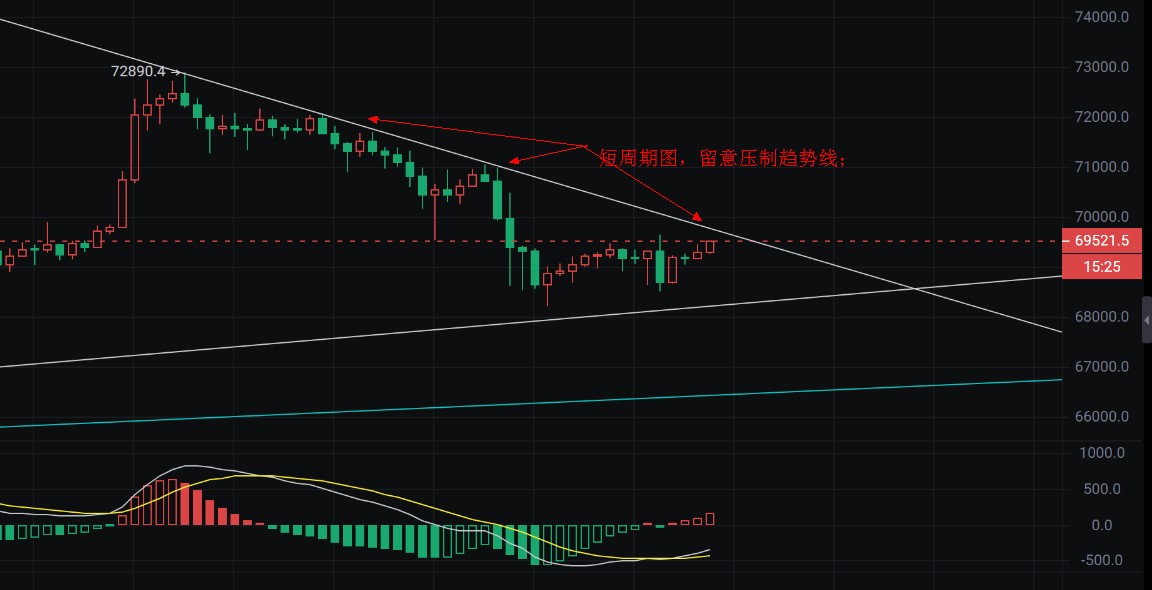
In the short term, although the 4-hour period has continued to close in a negative trend, the closing is above the 60-day moving average, which is indeed a good sign for long positions. For the moving average, there is still a great chance of a rebound and rise if it stabilizes. Furthermore, the short-term oscillating upward trend line also plays a relatively important role. Combining these two factors, overall, it is advisable to buy on dips in the short term and try to see above the midline of the 4-hour chart and near the upper rail of the daily chart. In addition: This week's CPI data is expected to be 3.4, which is expected to be bearish. If the actual announced value does not deviate too much, there is a high possibility of a retaliatory rally after the bearish news is fully priced in. Of course, this is only a possibility, and the specific situation depends on the actual data announcement and the market's decision near the key resistance level. Follow the market.
In terms of operations: Test the support at 68600, go long with a target of 70000 and 71000; short near 70200 and look back at 68800, with attention to the gain and loss of the midline in the daily chart. Buying on dips is the main strategy. Detailed trading should be based on the source of funds, and individual discretion should be exercised.
免责声明:本文章仅代表作者个人观点,不代表本平台的立场和观点。本文章仅供信息分享,不构成对任何人的任何投资建议。用户与作者之间的任何争议,与本平台无关。如网页中刊载的文章或图片涉及侵权,请提供相关的权利证明和身份证明发送邮件到support@aicoin.com,本平台相关工作人员将会进行核查。


