
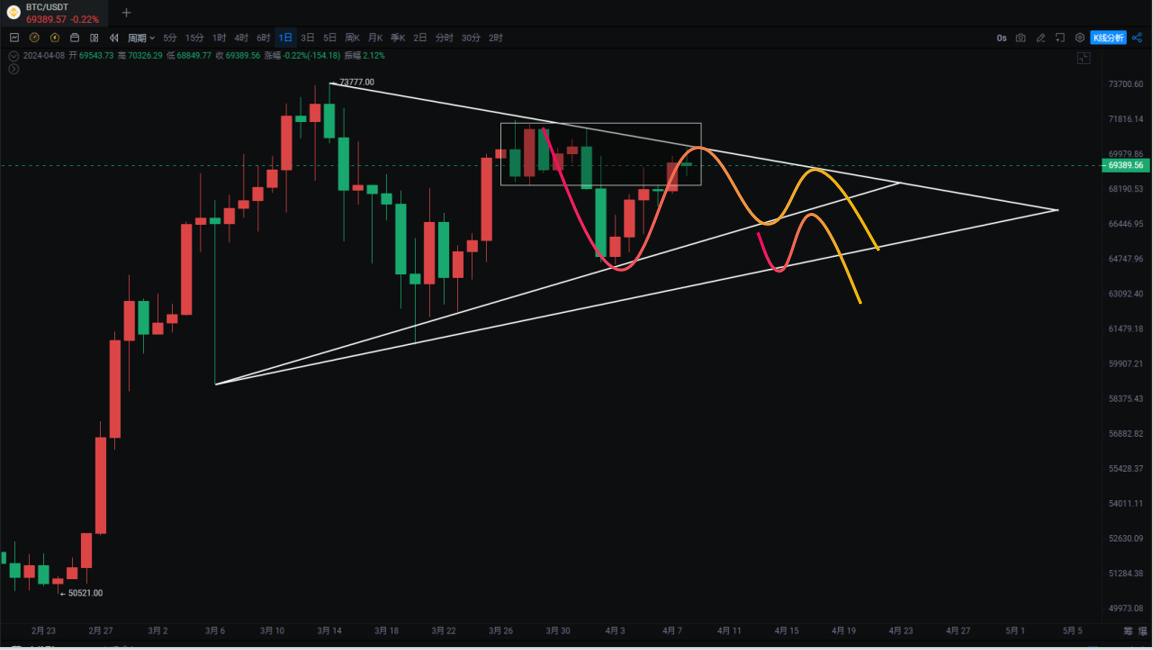
BTC replenished the gap between 64000 and 66500 before rebounding to touch 70326, which also happens to be the pressure point below the converging triangle. Spot positions are reduced to wait for the best bottom-fishing opportunity. The rebound of altcoins, led by Ethereum, is mainly due to the ETH/BTC exchange rate dropping to the freezing point of 0.048 and rebounding.
We have previously mentioned that this sequence generally follows BTC-ETH-rebound of strong altcoins-B-MEME dog tokens-plummet. We have observed this cyclical pattern since the bear market.
The market has been following this cycle, and whether the big coin will continue to be under pressure below 70000 is uncertain. After the rebound of Ethereum and other altcoins, the market is relatively dangerous.
In addition, with only 12 days left until the halving, it is uncertain whether the positive news will turn into negative. However, from the market trend, there is heavy pressure. The drop has not passed 72000, and this round of rebound has not exceeded 70326. The probability of a significant drop after multiple rebounds to test the high point is high. You can follow the bottom-fishing plan we previously suggested.
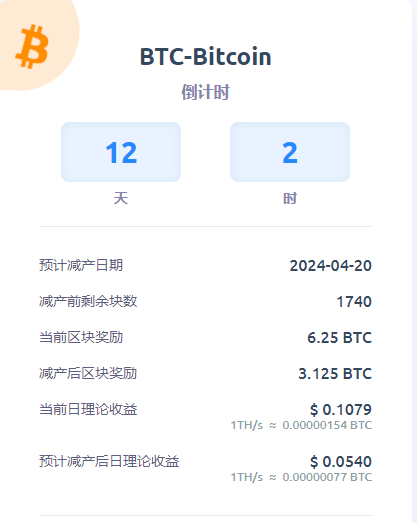
Bitcoin
The daily chart is still under pressure within the converging triangle. It is not advisable to operate when breaking through the upper boundary of the triangle as it is still under pressure from the previous box top. The triangle oscillation will continue, and consider adding long positions after a pullback. Refer to the previously published bottom-fishing plan.
The OBV yellow line is turning downward, indicating capital outflow. The MACD shows a bottom deviation, so be cautious of underwater growth and the fast and slow lines turning downward. Multiple indicators are bullish, but the market rebound is not strong, so be cautious of a significant decline.
Ethereum
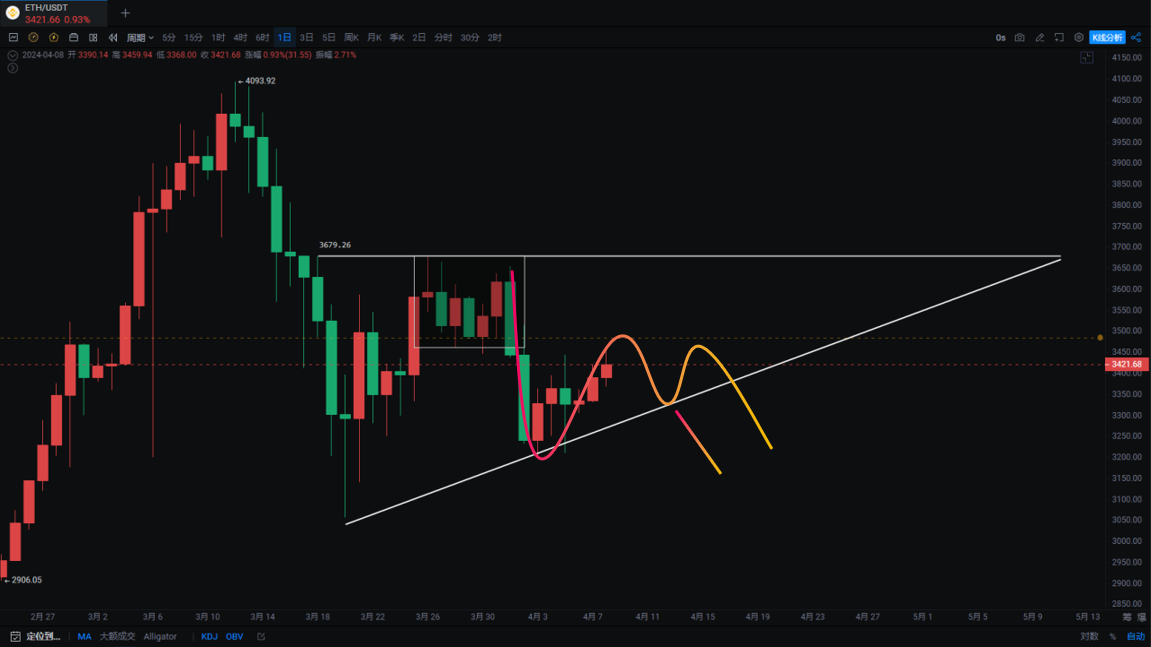
The BOLL of Ethereum is turning downward and narrowing, consistently suppressed by the BOLL midline. The daily chart also shows a descending triangle pattern. The risk on the market is greater than the opportunity. The MACD shows a bottom deviation, but the price has not shown a strong rebound. A bullish opportunity is only above 3678, and it is not ruled out that new lows of 2600-2800 may still be reached. A longer time and space are needed for a weekly level pullback.
The ETH/BTC exchange rate shows a bottom deviation, and it remains to be seen whether it can be pulled up. If it cannot be pulled up, altcoins will also decline.
If you like my views, please like, comment, and share. Let's navigate the bull and bear markets together!!!
The article is time-sensitive and is for reference only, with real-time updates.
Focus on candlestick technical research, and win-win global investment opportunities. Official account: Trading Master Fusu

免责声明:本文章仅代表作者个人观点,不代表本平台的立场和观点。本文章仅供信息分享,不构成对任何人的任何投资建议。用户与作者之间的任何争议,与本平台无关。如网页中刊载的文章或图片涉及侵权,请提供相关的权利证明和身份证明发送邮件到support@aicoin.com,本平台相关工作人员将会进行核查。


