Candlestick chart is a chart form used to display price trends, which includes information such as opening price, closing price, highest price, and lowest price within a certain time range. By observing the candlestick chart, we can analyze the price trend and make corresponding decisions. Below, Li Hui will explain in detail how to read the Bitcoin candlestick chart.

Time axis and time period: The Bitcoin candlestick chart is usually based on time as the horizontal axis, which can be in minutes, hours, days, weeks, or even months. Choosing the appropriate time period depends on your trading goals and time scale.
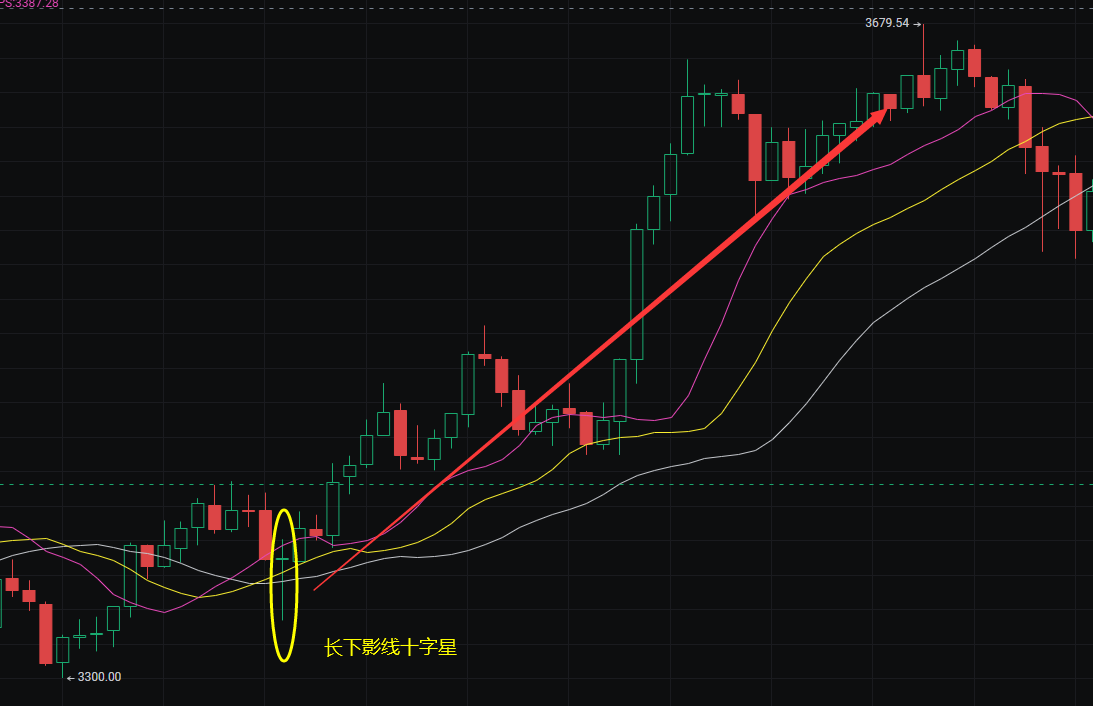
Candlestick pattern: Each candle represents a specific time period, composed of the candle's body and shadows. The color of the candle is generally divided into red (falling) and green (rising), and the specific color standards may vary depending on the trading platform settings.
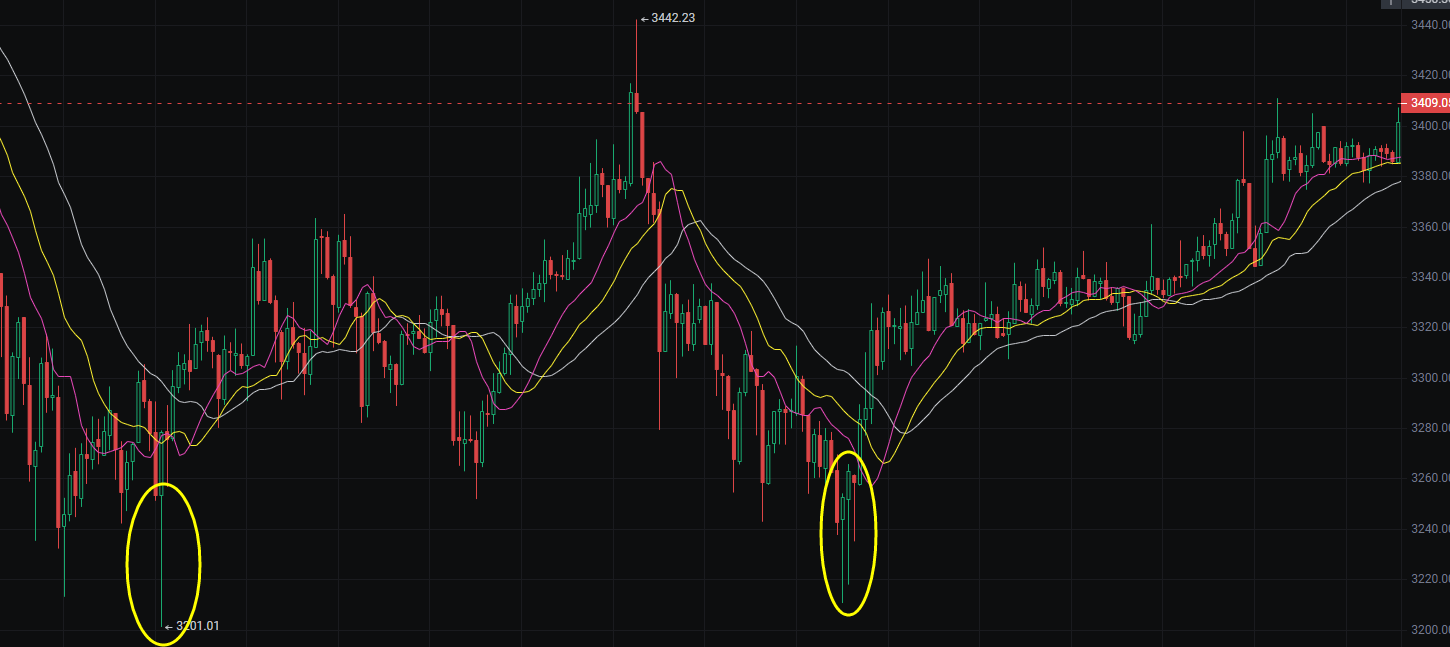
- Body: The body of the candle represents the price range between the opening and closing prices. If the candle is green, the opening price is below and the closing price is above, indicating a price increase; if the candle is red, the opening price is above and the closing price is below, indicating a price decrease.
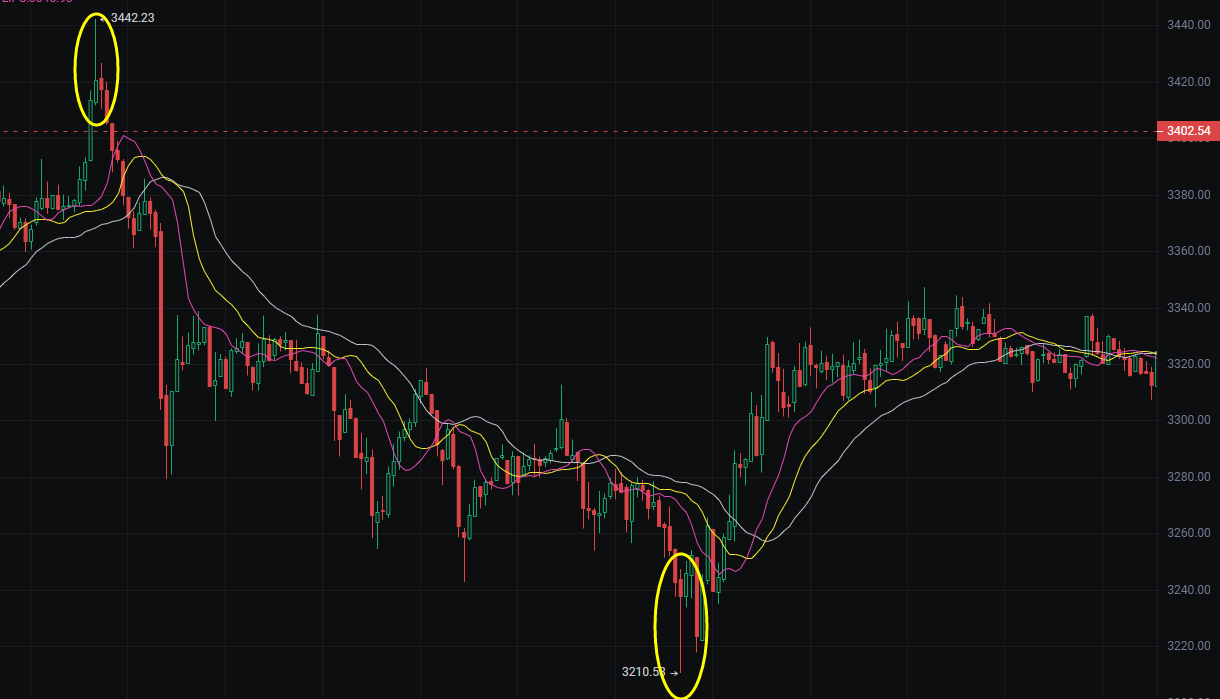
- Shadows: The upper and lower shadows of the candle represent the highest and lowest prices within that time period. The length of the shadows can provide more information, with longer shadows possibly indicating changes in market sentiment, reflecting the intensity of trading activity.
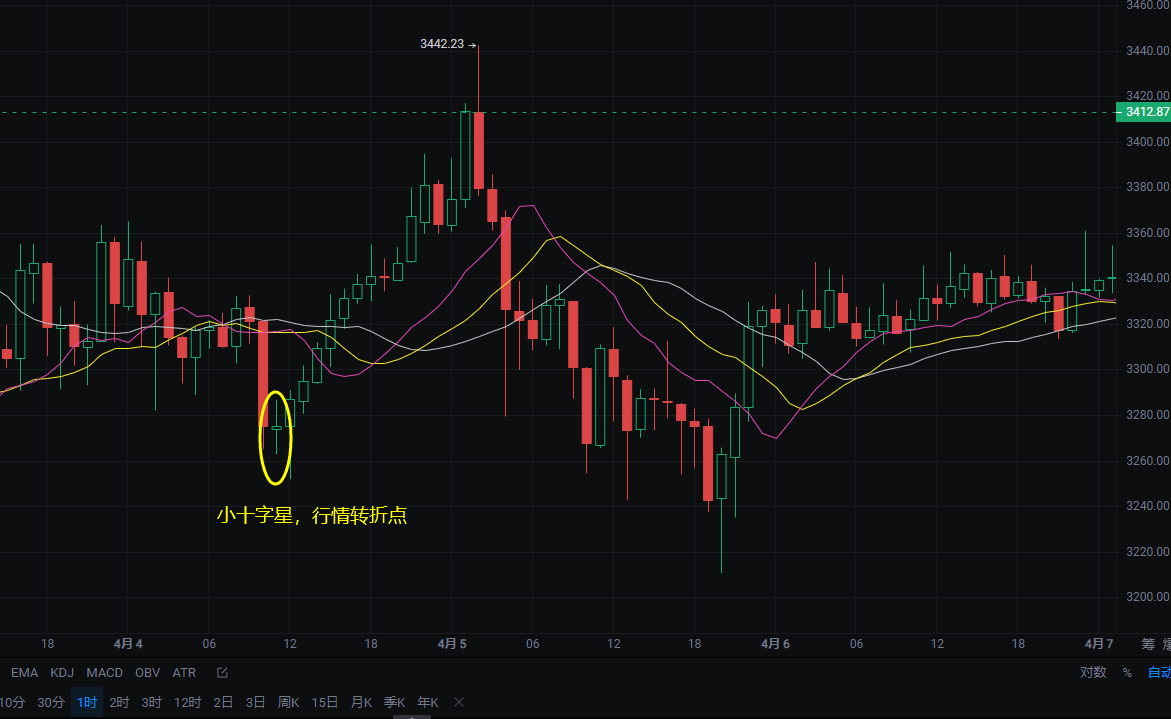
- Candlestick pattern: Candlestick pattern is a method of judging future price trends based on the arrangement and shape of the candles. Common candlestick patterns include bullish patterns (such as hammers), bearish patterns (such as hanging man, inverted hammer), and doji patterns, which often imply a reversal or continuation of the price trend.
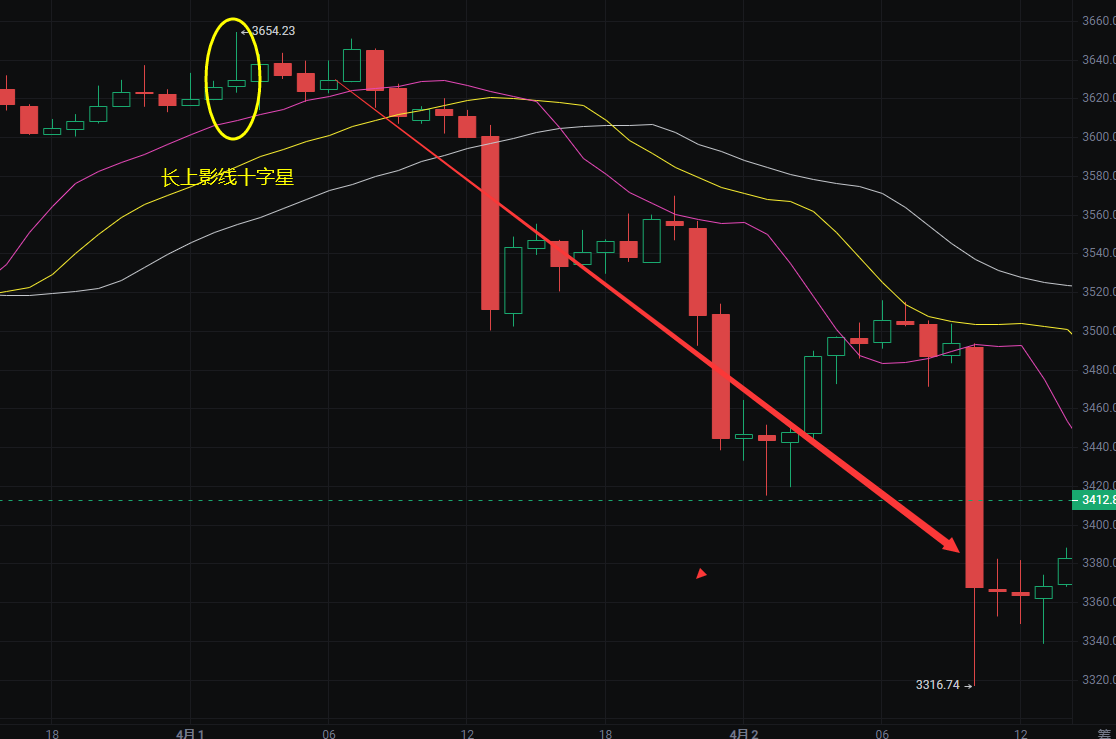
- Support and resistance levels: By observing the candlestick chart, we can identify the support and resistance levels of the price. The support level refers to the point where the price falls to a certain position and then rebounds, while the resistance level refers to the point where the price rises to a certain position and then encounters resistance. These support and resistance levels can help us formulate buying and selling strategies.
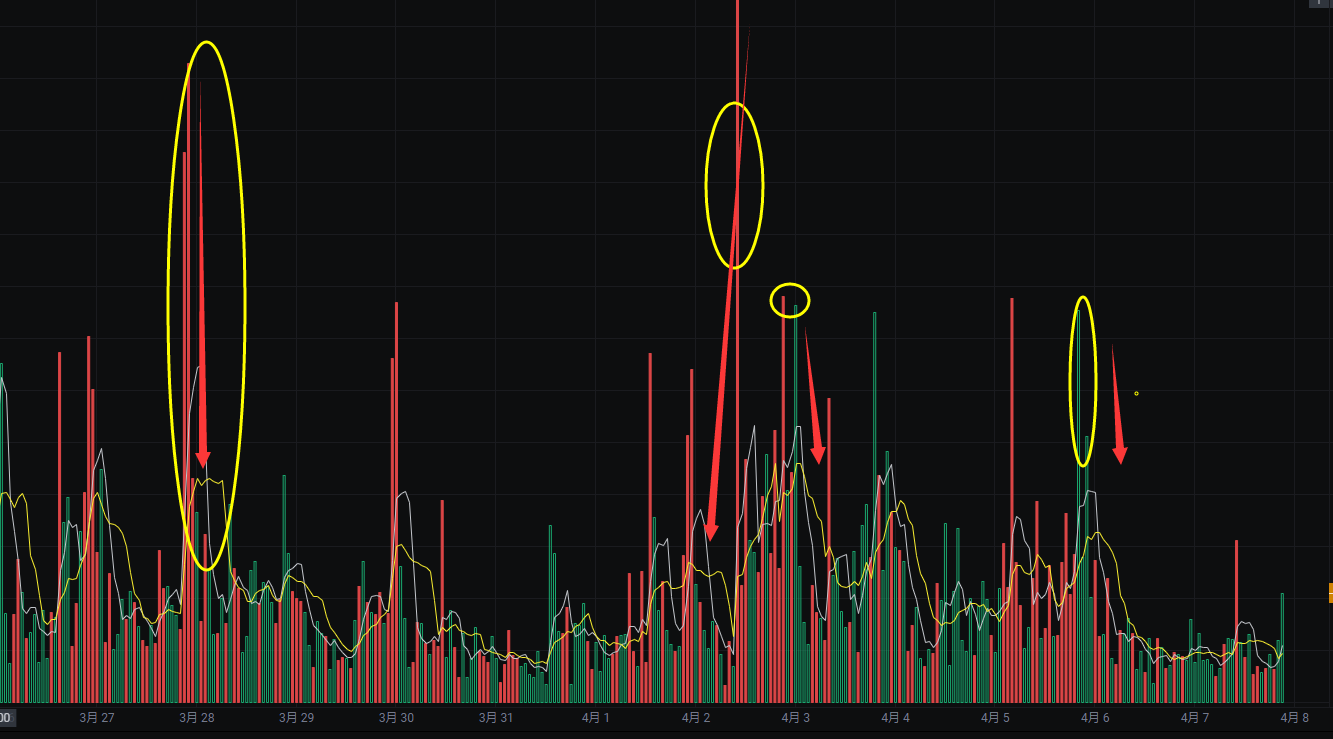
- Trading volume: The candlestick chart may also display a volume bar chart below, representing the size of the trading volume. Trading volume can provide validation of price trends and market reference, with larger trading volumes often accompanying price fluctuations.
- Importance of time dimension: When analyzing the Bitcoin candlestick chart, it is important to pay attention to the relationship between long-term and short-term trends. Charts with longer time scales can help us grasp the overall trend, while charts with shorter time scales are more suitable for specific analysis of buying and selling points.
Through observation and analysis of these aspects, we can better understand the price trends of Bitcoin and make corresponding trading decisions. Li Hui reminds everyone to note that the candlestick chart is just a tool and cannot be used as the sole basis for decision-making. It is necessary to combine other technical indicators and fundamental analysis for comprehensive judgment.
This article is exclusively published by Li Hui (WeChat: 张历辉) and does not represent any official position. The release and review of the article have a time delay, and the above points are for reference only. Readers are advised to be cautious and discerning. Thank you for reading.
免责声明:本文章仅代表作者个人观点,不代表本平台的立场和观点。本文章仅供信息分享,不构成对任何人的任何投资建议。用户与作者之间的任何争议,与本平台无关。如网页中刊载的文章或图片涉及侵权,请提供相关的权利证明和身份证明发送邮件到support@aicoin.com,本平台相关工作人员将会进行核查。


