Ancient people said: "Reading ten thousand books is not as good as traveling ten thousand miles; traveling ten thousand miles is not as good as having a famous teacher to guide you." In the field of digital currency, this famous saying is even more precious. It is well known that accumulating information and broadening one's knowledge is the first step to acquiring wisdom. However, the digital currency market is constantly changing and full of variables. It is difficult to deal with the challenges of practice based solely on theory. Only when one is in the situation can they truly understand the difficulties of moving forward. Traveling ten thousand miles may be awe-inspiring or full of enthusiasm, but it is also full of dangers. However, with the careful guidance of a famous teacher, one can avoid going astray, manage risks, and navigate through this vast world. Zhang Lihui is willing to explore the mysteries of digital currency with everyone, to open up the path of investment, and not to disappoint the golden age. He hopes that everyone will pick up the banner of struggle and embark on this challenging and opportunistic journey with him. Let us move forward together and create your own brilliance!
Zhang Lihui: Today, I will share the changes and applications of the common EMA trend lines!
EMA7-EMA120 is a commonly used exponential moving average indicator, which is calculated based on different time periods. Below is Zhang Lihui's detailed explanation of these indicators:
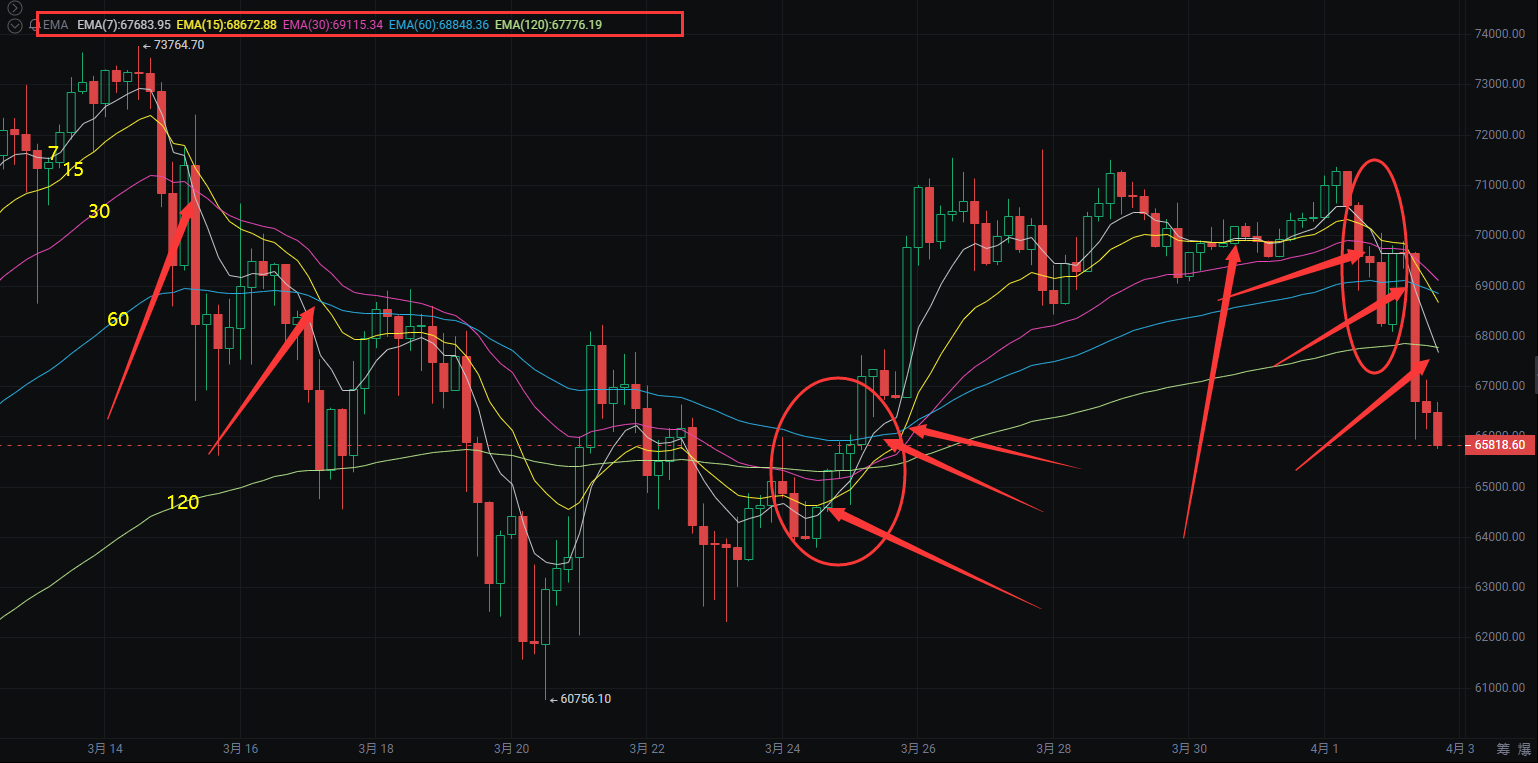
EMA7 indicator: EMA7 is the exponential moving average line calculated based on 7 trading periods. It sensitively reflects the recent price fluctuations and can track short-term price trends. EMA7 is commonly used for short-term trading to help track short-term price trends and quickly respond to market changes.
EMA15 indicator: EMA15 is the exponential moving average line calculated based on 15 trading periods. Compared to EMA7, EMA15 is smoother and can better capture medium-term price trends. EMA15 is usually used for medium-term investment analysis to help judge the medium-term price trend.
EMA30 indicator: EMA30 is the exponential moving average line calculated based on 30 trading periods. It has a longer period and can provide a relatively stable price average line. EMA30 is commonly used for medium to long-term investment analysis to judge the medium to long-term price trend.
EMA60 indicator: EMA60 is the exponential moving average line calculated based on 60 trading periods. Compared to the previous indicators, EMA60 is smoother and can reflect longer-term price trends. EMA60 is usually used for long-term investment analysis to identify long-term price trends.
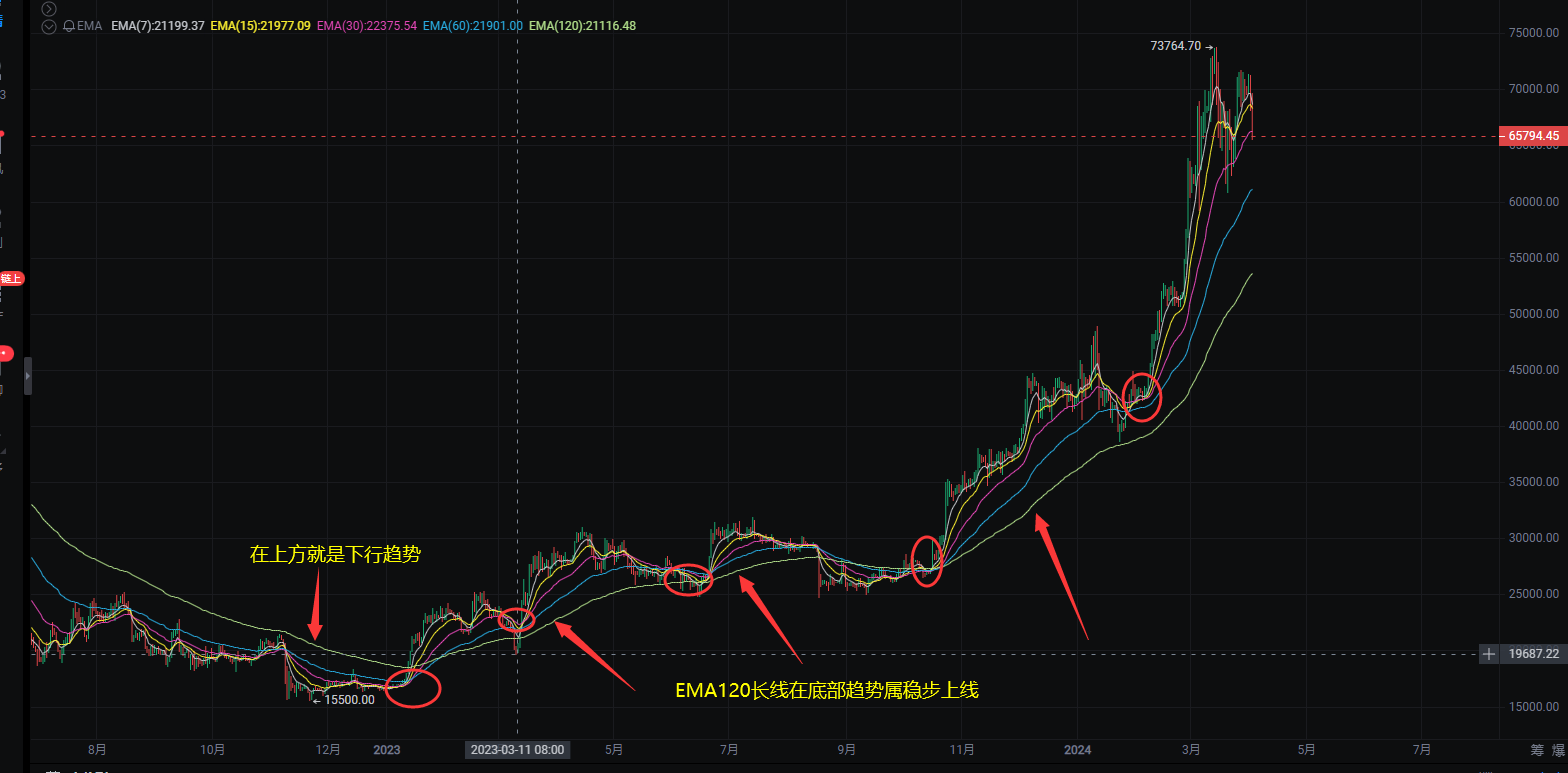
EMA120 indicator: EMA120 is the exponential moving average line calculated based on 120 trading periods. It has the longest period and can provide the smoothest price average line. EMA120 is commonly used for ultra-long-term investment analysis to identify ultra-long-term price trends.
To determine the use of EMA7, EMA15, and EMA30 as entry and exit points, Zhang Lihui reminds everyone to pay attention to the following changes:
Price crossing: Observe whether the price has crossed the EMA line. When the price crosses the EMA line from below and stabilizes above the EMA line, it may indicate the beginning of an uptrend and buying can be considered. Conversely, when the price crosses the EMA line from above and stabilizes below the EMA line, it may indicate the beginning of a downtrend and selling can be considered.
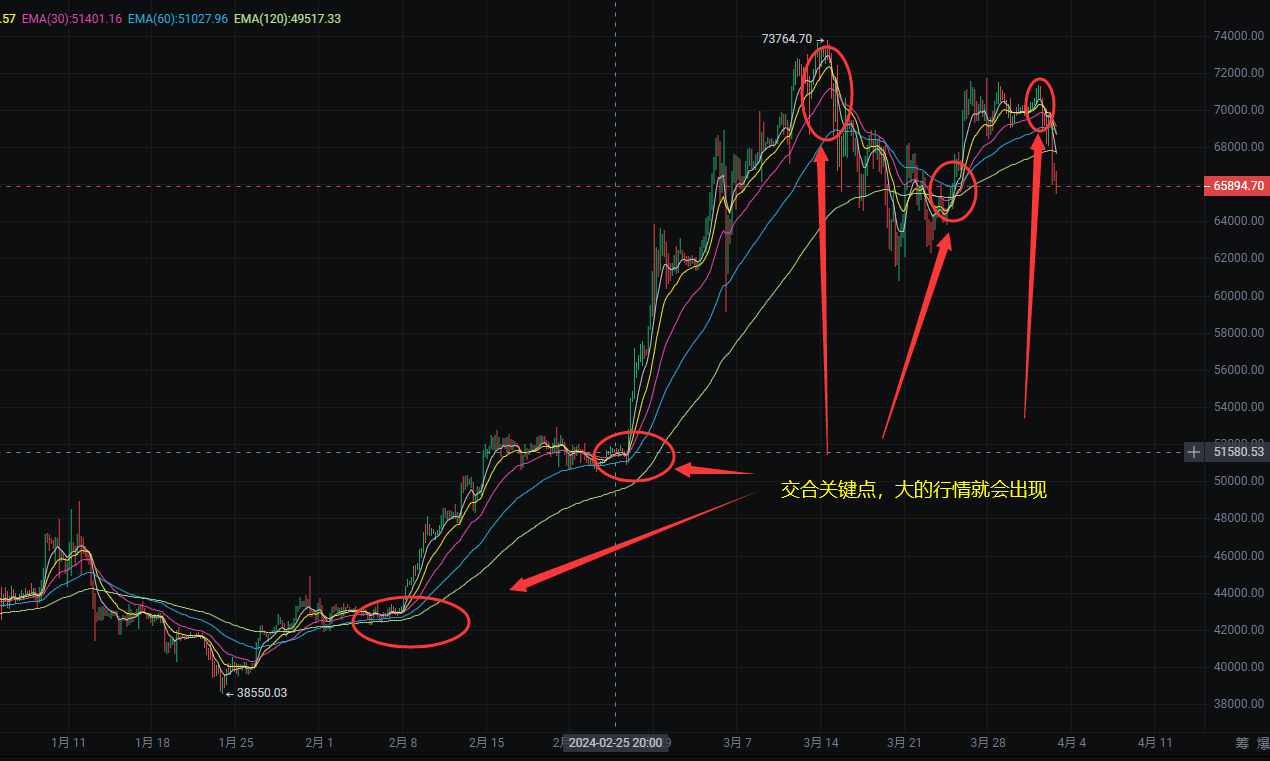
Moving average crossover: Observe the crossover between different EMA lines. When the short-term EMA line (such as EMA7 or EMA15) crosses the long-term EMA line (such as EMA30) from below to above, it is called a "golden cross," indicating that the price may start to rise, and buying can be considered. Conversely, when the short-term EMA line crosses the long-term EMA line from above to below, it is called a "death cross," indicating that the price may start to fall, and selling can be considered.
Trend of the moving averages: Observe the direction of the different EMA lines. If the trend of each EMA line is upward, it indicates an upward price trend, and buying can be considered. Conversely, if the trend of each EMA line is downward, it indicates a downward price trend, and selling can be considered.
Relative relationship between moving averages and prices: Observe the relative position of prices to the EMA lines. If the price is above the EMA lines and the EMA lines are sloping upwards, it indicates relative strength in price, and buying can be considered. Conversely, if the price is below the EMA lines and the EMA lines are sloping downwards, it indicates relative weakness in price, and selling can be considered.
These changes and observations can be used to determine entry and exit points, but they need to be combined with other technical indicators and an overall analysis of the market situation. At the same time, Zhang Lihui reminds everyone to pay attention to risk management, set stop-loss and profit targets to help control risks and protect capital. Most importantly, technical analysis is only part of the decision-making process, and fundamental analysis, news, and other market factors should also be considered.
I, Zhang Lihui, interpret world economic news, analyze the global trend of the currency circle, and have conducted in-depth research on currencies such as BTC, ETH, LTC, DOT, EOS, BNB, SOL during my studies in the United States. For those who are not familiar with operations, I welcome your comments and messages!
You can follow the author by scanning the QR code below!

This article is exclusively published by (WeChat Official Account: Zhang Lihui) and does not represent any official position. The release and review of the article have a time delay, and the above points are for reference only. Risk is self-assumed! May we always carry humility and courage in this complex currency circle, fear no challenges, and dare to explore. Just as traveling ten thousand miles, "the road ahead is long and far-reaching, I will seek and explore." May we continue to read ten thousand books, keep pace with the times, and draw wisdom. Travel ten thousand miles, experience storms, witness scenery, and comprehend life. With Zhang Lihui's guidance, may you heed advice, play to your strengths, and create value together. May we always remember the baptism of the market, not forget our original intentions, and persist. In the wave of digital currency, holding onto faith with Zhang Lihui, let's forge ahead with determination. May we jointly compose the future's brilliant chapter and share the joy of success. Let us gather in the turbulent world of digital currency, live up to the prime of life, and create brilliance together. Zhang Lihui is willing to embark on this challenging and opportunistic investment journey with you.
免责声明:本文章仅代表作者个人观点,不代表本平台的立场和观点。本文章仅供信息分享,不构成对任何人的任何投资建议。用户与作者之间的任何争议,与本平台无关。如网页中刊载的文章或图片涉及侵权,请提供相关的权利证明和身份证明发送邮件到support@aicoin.com,本平台相关工作人员将会进行核查。