3/27/Community: ETH Daily Line Long-legged Doji; Peak?
Live broadcast sharing various mainstream technical indicator application methods, as well as daily technical analysis;


[ETH/Daily Chart]
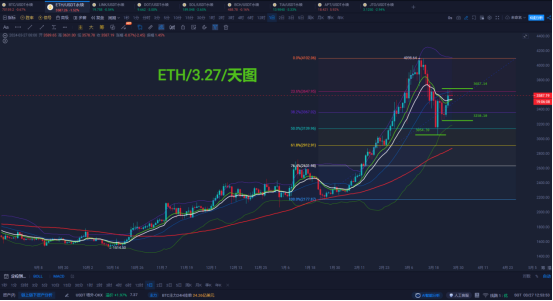
ETH/Daily Chart Technical Trend Analysis: Ethereum's trend performance yesterday relied on Monday's rise and a slight surge on Tuesday.
After encountering resistance at 3685, it entered a narrow range consolidation, and the daily line was under pressure at the midline of the Bollinger Bands, forming a long-legged doji, bringing some uncertainty to the short-term market. It could either continue to rise or encounter resistance in the short term and fall back. Looking at the daily line, if the bulls fail to continue to break through 3685 in the next two days, there will be an expectation of a pullback. The pullback will only confirm the support role of 3250-3350 before. Once the support is confirmed again, there will be a better and healthier bullish performance. If the bulls gain momentum and break through 3685-3700 during the European and American trading sessions today, then 3800 to 3850 will be the next targets.
[ETH/4H Chart]
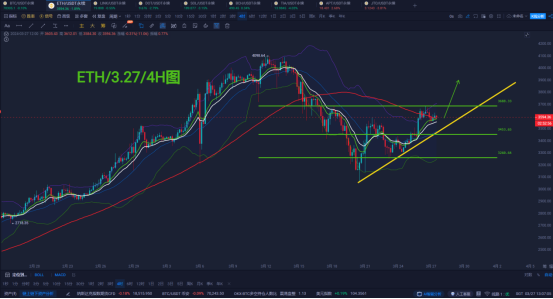

ETH/4H Technical Trend Analysis: The technical trends of the 4-hour and 2-hour charts are basically the same, with the difference being that the three moving averages on the 4-hour chart have not formed a golden cross, while the 2-hour chart has entered the golden cross range. The trend from last night to the present, as expected during the live broadcast, is consistent. If 3685-3700 is a short-term resistance that cannot be broken, there will be a demand for retracement and adjustment. After the adjustment, the probability of an upward trend is greater than the downward trend. The first target after effectively breaking through 3685-3700 remains at 3800. Today's view: The uncertainty of the doji on the daily line brings some uncertainty to the long and short positions at the daily level, but the bullish trend on the 4-hour and 2-hour charts remains intact, especially the golden cross phase of the 2-hour technical trend and the combination of the upward trend line. The bullish view remains unchanged above 3500, especially for those who are tracking this strategy. Those with long positions near 3300 should continue to hold and wait for the 3800 take-profit level. If it falls below 3500, all profits can be taken.
For more details, please feel free to enter the live broadcast room for discussion, learning, and exchange!

Recommended Approach [Bullish on Oscillating Bottom]
Support 3520-3500/Resistance 3680-3800
Tencent Meeting ID: 565-877-8060
Seven live broadcasts daily: 14:00-21:30 uninterrupted

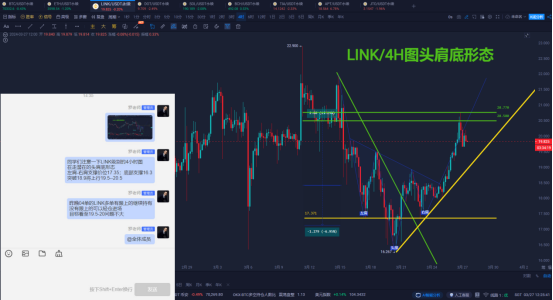
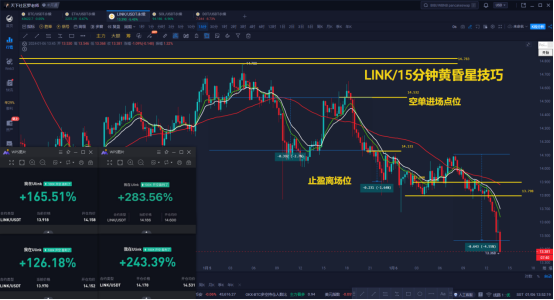
LINK/4H Strategy Tracking Tips: On March 22-23, as expected, the 4-hour head and shoulders bottom pattern and the first and second bullish targets of 19.5-20 were perfectly reached, touching the highest price of 20.765. Partners who have seriously treated and tracked this strategy should have a profit of 600%-1000%. We will continue to track the next long and short opportunities for LINK.


[Hunting for Gold] What can you get from the Elite Class?
1. Get the midday video for the first time//2. Get the market's intraday views for the first time
3. Get short, medium, and long-term strategies for the first time//4. Track and guide the strategy throughout
5. Have the opportunity to participate in exclusive midnight battles//6. Have the opportunity to participate in million-dollar value courses
[Efficient. Accurate. Capturing Breakout Trading Opportunities]


2022 Annual Strategy Guidance Record
February-December 2022///10 wins, 1 loss
February complete/return rate 2500%///March complete/return rate 2500%
April complete/return rate 2626%///May complete/return rate 3698%
June complete/return rate 3081%///July complete/return rate 7033%
August complete/return rate 4694%///September complete/return rate 5046%
October complete/return rate 1438%///November complete/return rate 2362%
December complete/return rate -474%///
February-December 2022 complete total return rate 34504%
Single margin of 100U*34504%=34504U
Each strategy//has a basis, can be traced back to the start time to the year, month, day/hour, minute, second, and has graphic and textual records. If interested, scan the code to join the group for certification!!


免责声明:本文章仅代表作者个人观点,不代表本平台的立场和观点。本文章仅供信息分享,不构成对任何人的任何投资建议。用户与作者之间的任何争议,与本平台无关。如网页中刊载的文章或图片涉及侵权,请提供相关的权利证明和身份证明发送邮件到support@aicoin.com,本平台相关工作人员将会进行核查。


