Daily Sharing
As Bitcoin surged above 70,000 again last night, it indicates that Bitcoin has successfully completed an upward trend at the 4-hour level, and this upward trend is not over yet, with expectations of reaching a new high. With Bitcoin breaking through 70,000 again today, most altcoins have also rebounded to their previous positions before the recent decline, confirming once again our recent judgment that a pullback is an opportunity rather than a crisis.
In the market, many people tend to continue looking for lower positions when the price falls, which is not wrong in itself, but you need to be flexible and adapt to the market. When Bitcoin fell to around 60,775 last week, many people started to panic, thinking it would further drop to 53,000, or even 48,000.
However, I actively bought the dip, repeatedly suggesting to long Bitcoin near 60,000, 61,000, to long Ethereum near 3150, 3000, and to long Litecoin 3 times in the 75-80 range. I also suggested other spot purchases of altcoins. From the current situation, it is evident that buying the dip has yielded significant gains. Overall, it has realized my previous predictions.
Currently, Bitcoin is still running a 4-hour rebound. Once this rebound is completed, there is a high probability of reaching a new high again. After reaching a new high, it will be time to consider gradually reducing spot positions and slowly building a small amount of short positions. However, personally, I estimate that the overall daily pullback is unlikely to happen so quickly. There is a high probability of constructing a 4-hour consolidation after the third new high to confuse the market, and then starting a new daily level decline.
In any case, when a new daily level decline appears, it will be necessary to avoid risks, as it is expected to pull back for 2-3 months at that stage, and then soar again towards the 100,000 target.
BTC
Due to the rapid changes in the market, this article can only make predictions about the market changes at the moment of publication. Short-term players should pay attention to the latest market changes and use this information as a reference only.
1H:
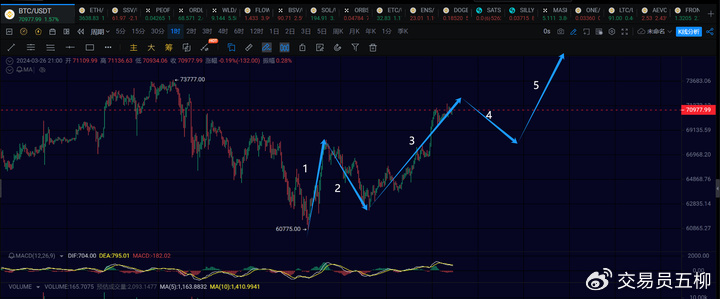
At the 1-hour level, it is currently uncertain whether the third 1-hour level uptrend has ended. If it falls below 69,400 in the evening, it is highly likely that the 1-hour rebound has ended, and a fourth 1-hour level pullback will follow. Pay attention to 67,000 and 66,000 during the pullback. Due to the comparison of the strength between the third and first 1-hour uptrends, without divergence, it is expected that there will be a fifth 1-hour level uptrend, which should be able to reach a new high again.
But if it does not fall below 69,400 in the evening, it is possible to continue the third 1-hour level uptrend extension, and attention should be paid to whether it will break through 73,777.
15M:
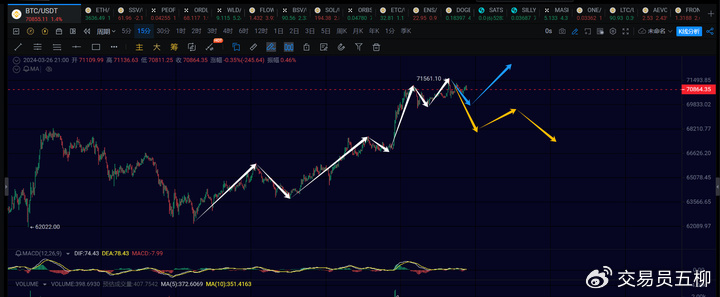
At the 15-minute level, the uptrend from 62,260, which started the 1-hour level uptrend, may have been completed. Currently, a 15-minute level pullback is in progress. Pay attention to the intensity of this pullback. If it does not fall below 69,400 from the evening to early morning, there may be a consolidation of a 15-minute level consolidation, followed by an extension of the 1-hour level rebound, as shown by the blue arrow in the chart.
If it falls below 69,400, it is likely to undergo a 1-hour level pullback, as indicated by the yellow arrow in the chart. After the 1-hour level pullback is completed, there will be a fifth 1-hour level uptrend.
ETH
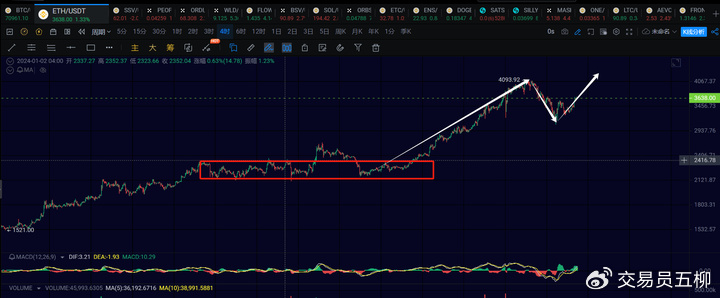
For Ethereum, the rebound at the 4-hour level is still an upward trend of the three buys below the consolidation, so it should be able to continue to reach a new high in the short term. Therefore, pay attention to whether it can break through 4,100.
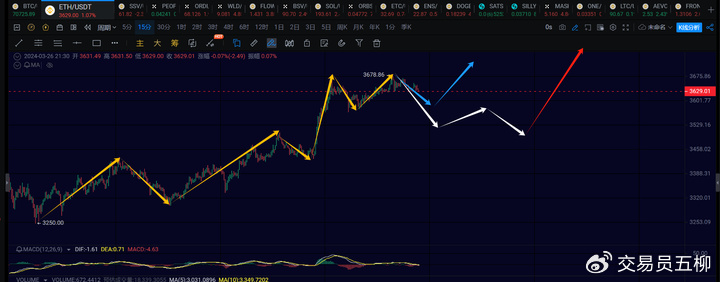
At the 1-hour level, similar to Bitcoin, it has completed the third 1-hour level uptrend. Since the third uptrend does not diverge from the first one, it is expected that there will be a fifth 1-hour level uptrend.
Currently at the 15-minute level, pay attention to the intensity of the pullback. If it does not fall below 3,572, there is still a possibility of constructing a 15-minute level consolidation to continue the 1-hour level rebound, as shown by the blue arrow in the chart. If it falls below 3,572, then expect a 1-hour level pullback, with a target of 3,450, as indicated by the white arrow in the chart. It is important to note that after the 1-hour level pullback is completed, there will be a fifth 1-hour level uptrend.
Trend Direction
Weekly Level: Upward, currently a continuation of the weekly rebound from 15,476, pay attention to the subsequent daily level situation for when it will end.
Daily Level: Upward, adjust the target of the daily uptrend to around 76,000 or 80,000.
4-hour Level: Upward, currently running a 4-hour level uptrend, with a high chance of reaching a new high in this uptrend.
1-hour Level: Downward, there is a possibility of a 1-hour level pullback.
15-minute Level: Downward, watch whether the 15-minute level pullback breaks 69,400. If it does not, it will continue to extend.
Feel free to follow my public account for further discussion and exchange:

The article is time-sensitive, so be cautious of risks. The above is only personal advice and is for reference only!
免责声明:本文章仅代表作者个人观点,不代表本平台的立场和观点。本文章仅供信息分享,不构成对任何人的任何投资建议。用户与作者之间的任何争议,与本平台无关。如网页中刊载的文章或图片涉及侵权,请提供相关的权利证明和身份证明发送邮件到support@aicoin.com,本平台相关工作人员将会进行核查。


