Click to watch the video: Master Chen's 3.23 Video: Analysis of Market Medium and Long-term Bottoms and Tops, Indicator Judgment of Buying Points
Today's video will share simple methods for bottom fishing or escaping the top, including the fact that Bitcoin broke the short-term support of 64,000 yesterday. Let's discuss how to deal with spot and medium to long-term positions.
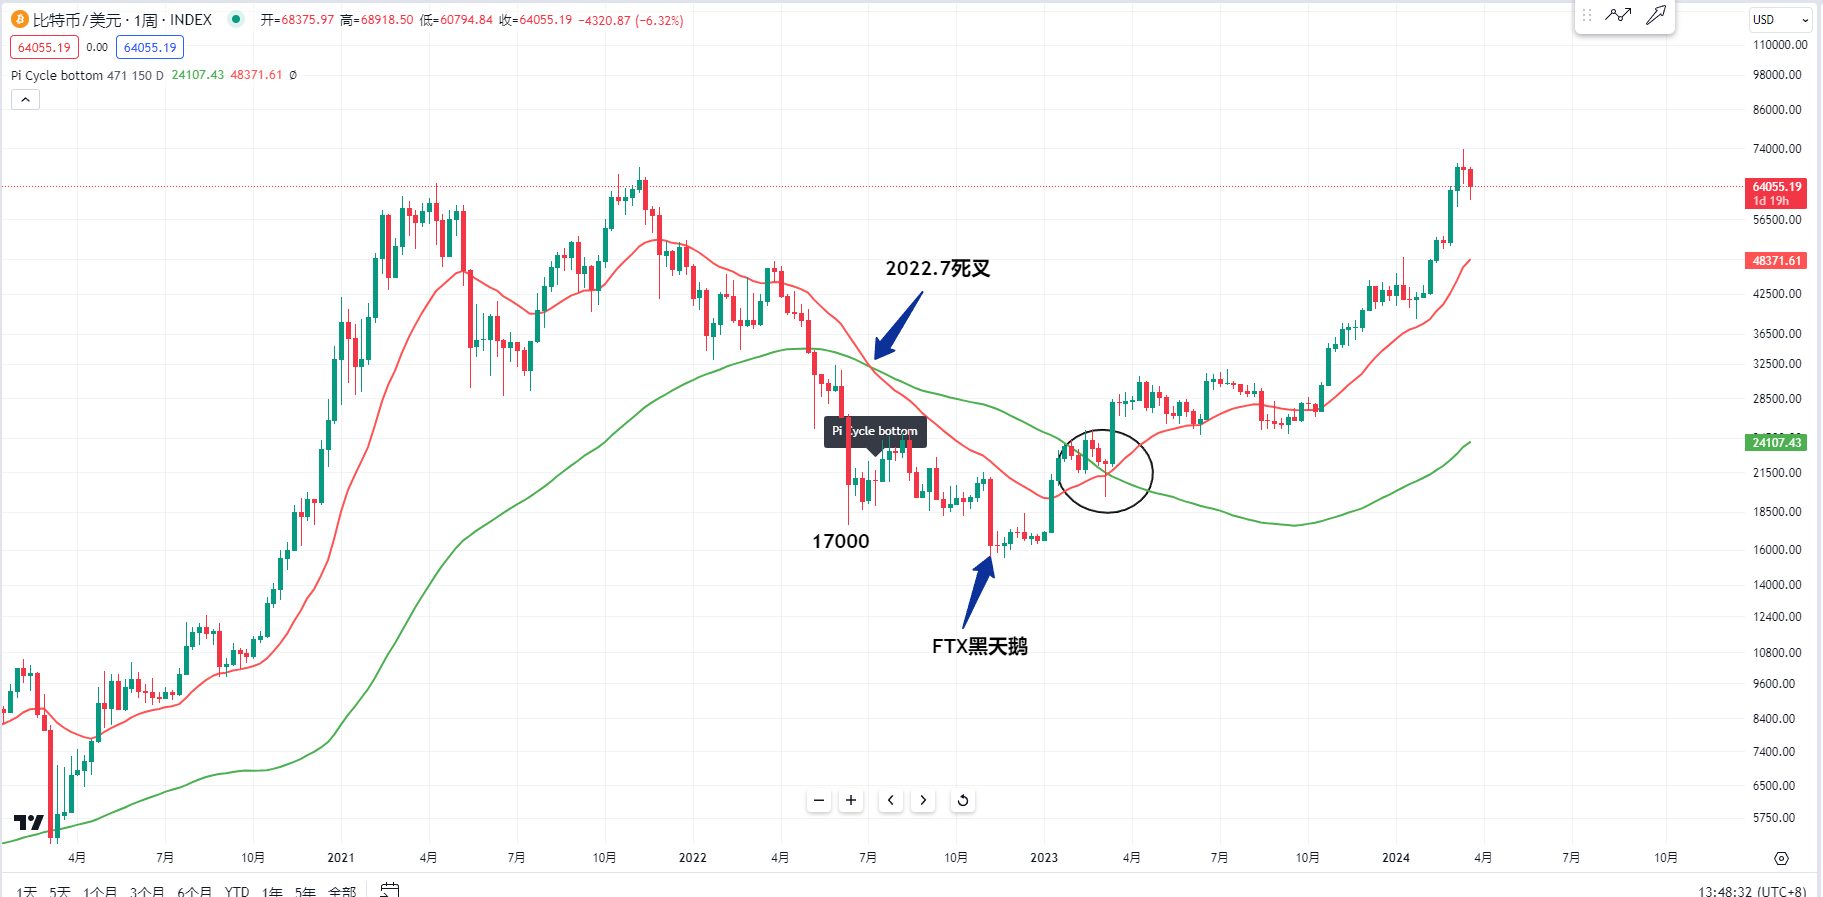
First, let's look at the weekly level of Bitcoin. The Pi cycle indicator of Bitcoin, which I have mentioned before, is a simple method for bottom fishing. We need to look at this indicator. Let's first look at the position in July 2022. At that time, the Pi cycle indicator's red line death cross the green line, roughly at 20,000 or below, which is a very important bottom for Bitcoin.
If there were no black swan events from the FTX exchange later, I believe it definitely would not have fallen in this range. So, the death cross position may be a very important bottom.
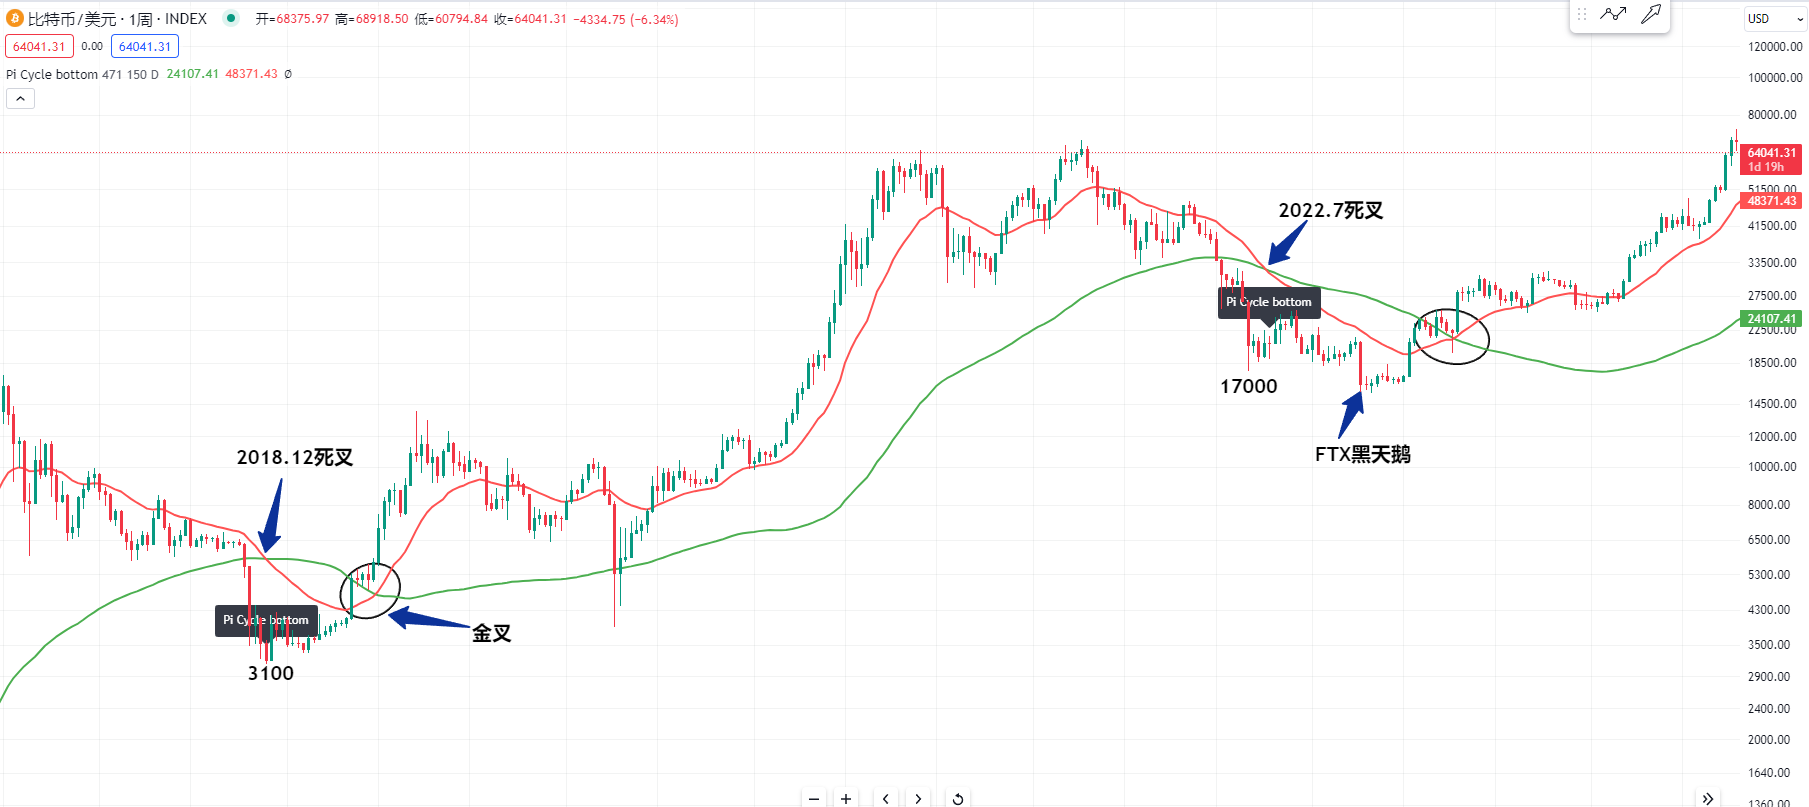
Because we can see that in the three to four years, only in December 2018 did the red line and green line of Bitcoin have a death cross. In 2018, Bitcoin fell to $3,000, which was a very important bottom. The subsequent low has never been broken.
And we can also see that after this red line, there was a long period of golden cross until 2022, when it had a death cross again at this position.
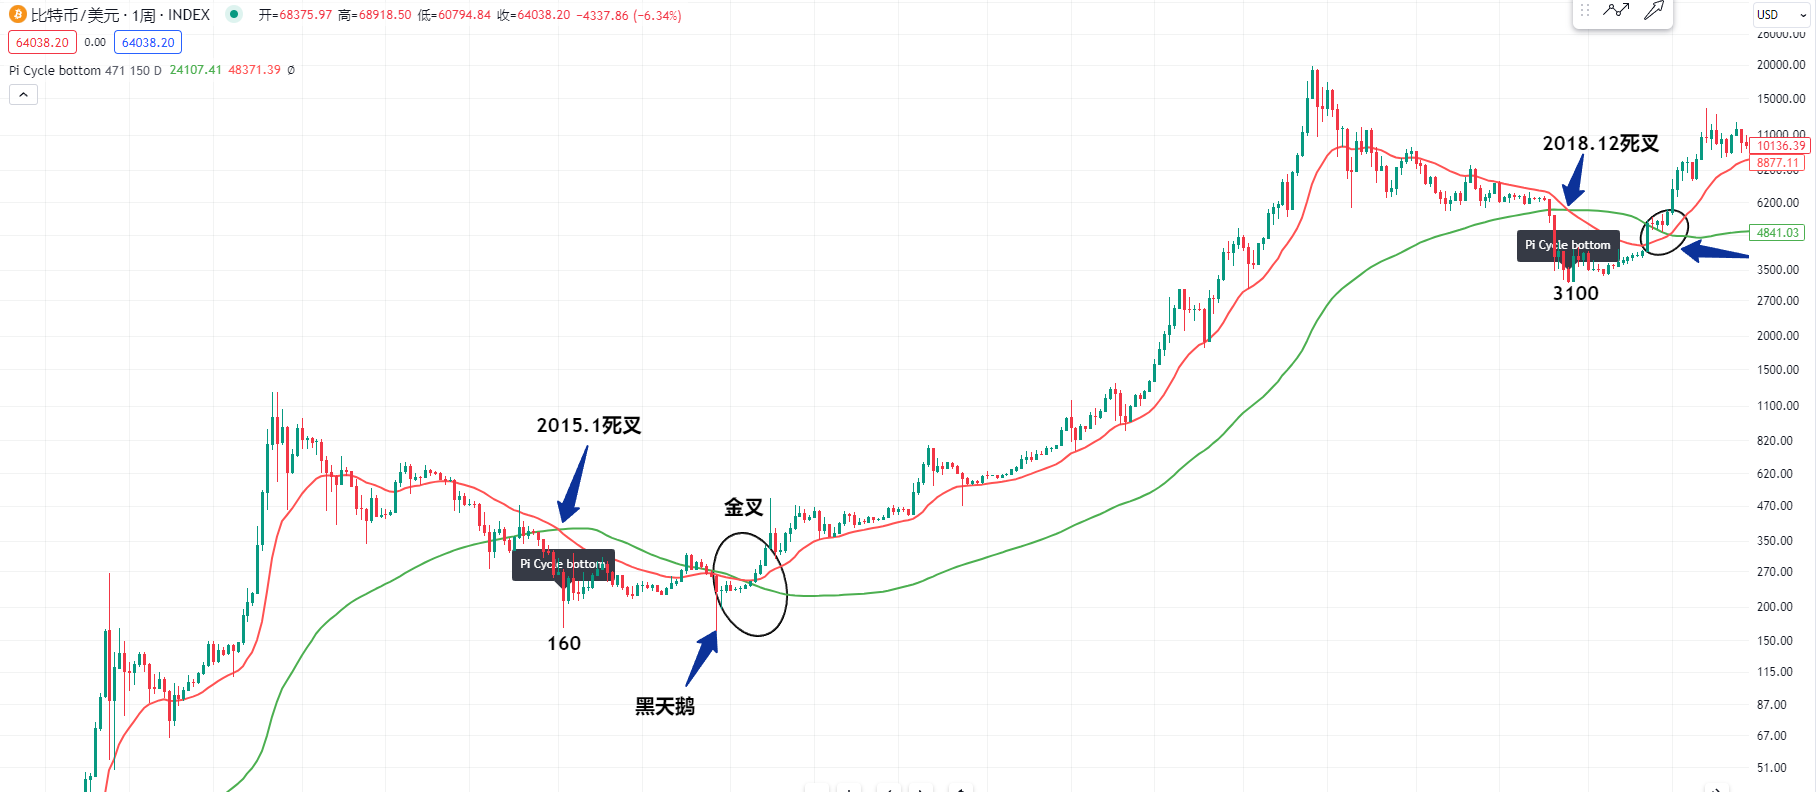
So, we can see that earlier, before 2019, the time of its death cross was even earlier, in 2015. Similarly, it was a long time interval. In December 2015, the Pi cycle indicator's red line death crossed the green line, and at this position, Bitcoin fell to $160, which was a very important bottom.
Although there was a black swan event later that broke this low, we can observe that in this range in 2015, as long as you buy spot and hold it to the future top, there will be unexpected profits. Next, let's talk about the top Pi cycle top indicator, which is also a very simple method for escaping the top.
Since we have bought at the previous bottom, and now Bitcoin has risen, but I think it is still too early to talk about the top of Bitcoin. We can use the Pi cycle top indicator to judge the method of escaping the top.
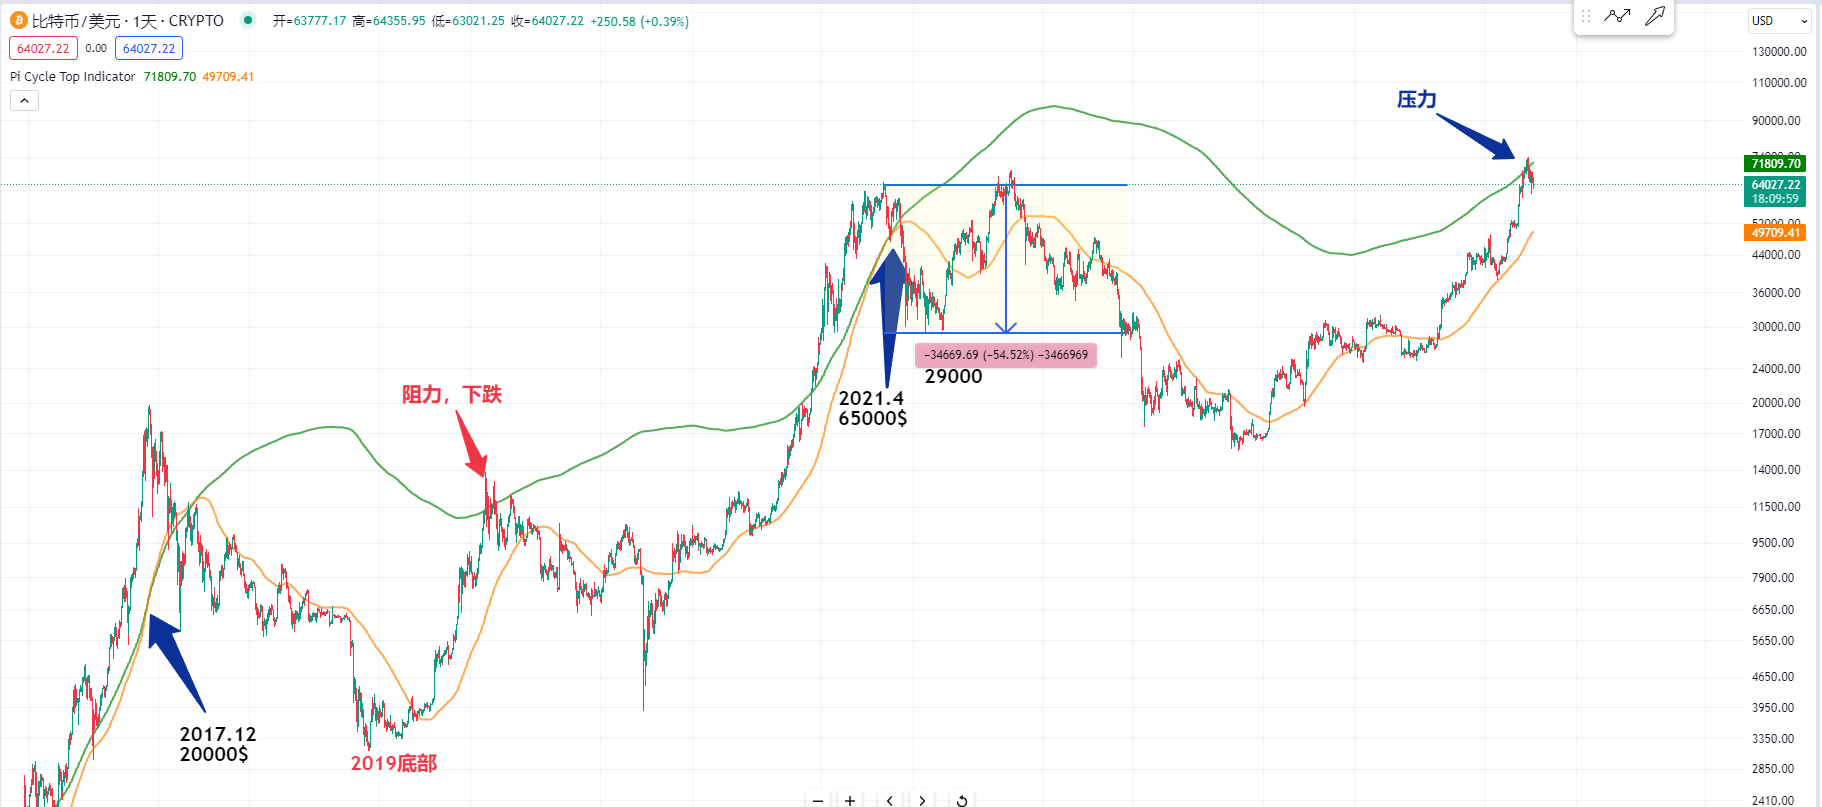
A few days ago, I also mentioned in the video that this Pi cycle top top indicator is used to observe the daily level of Bitcoin. It is these two lines. When the orange line below crosses the green line above, we need to be careful. It may be the top of Bitcoin.
We can observe that the orange moving average line is still very far from the green line. A few days ago, I also mentioned in the video that the Pi cycle top top indicator in history is also very famous. In 2021, when Bitcoin rose to a high of 65,000, we can observe that as long as the orange line crossed the green line, it was the top of Bitcoin around 2021. It fell from 65,000 to 29,000, which was a drop of more than 50%.
Let's also observe that in the long period of 4 to 5 years, the previous top of Bitcoin was also this Pi cycle top indicator in December 2017. The orange line continued to rise to this high point, and when it crossed the green line at this position, it was a very important top for Bitcoin in 2017.
Or we can observe that in the earlier bull market in 2012, we can observe that this orange line crossed the green line in April 2013, which was the first top at this position, or Bitcoin continued to rise later. We can also observe that in December 2013, it was the same. This red line crossed the green line, which was a very important top for Bitcoin.
So, we can observe that it is still too early for the top of Bitcoin. For spot and medium to long-term positions, the cost of buying at the bottom is relatively low, so everyone can still hold it with confidence. It may fall in the short term at the current position.
Some friends are also asking, if Bitcoin doesn't rise at this position, we can observe that if the green line of the Pi cycle top indicator is close to this position before the halving of production in history, we need to be careful. It may retreat in the short term.
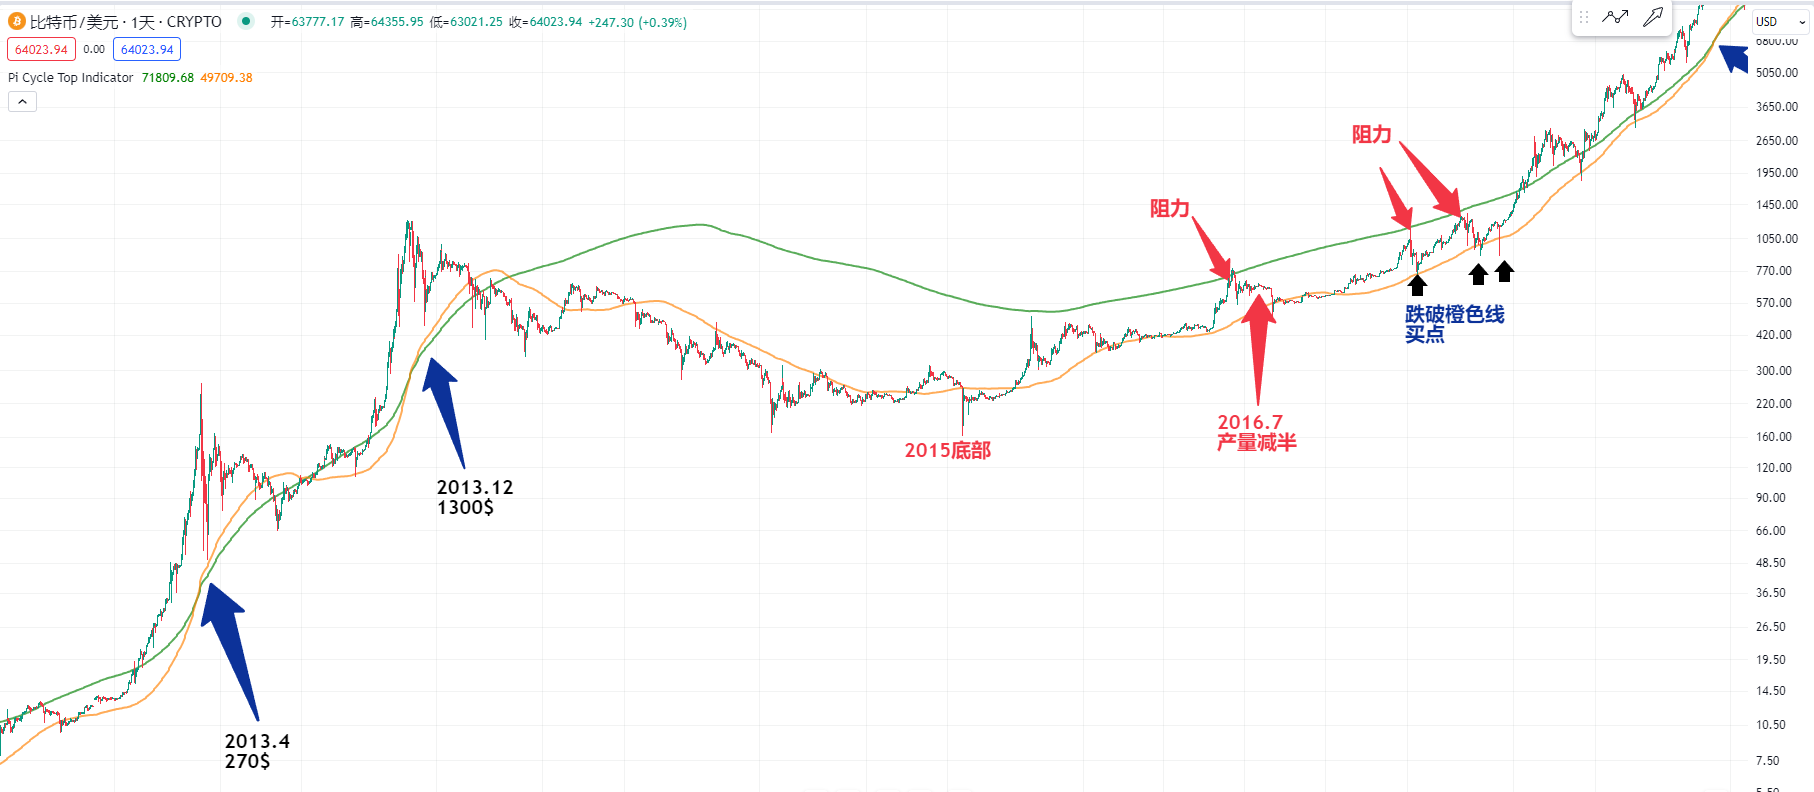
Because we can observe that after Bitcoin's bottom in 2019, when it rose to the position of the green line, there was also a short-term resistance here, and Bitcoin started to fall later.
Or we can also observe that in the bull market of Bitcoin in 2015, after the bottom, the first wave of the uptrend was also close to the position of the green line. Later, Bitcoin fell because it had not yet halved production at that time.
Or we can also observe that around July 2016, when the halving of production occurred, the first wave of the uptrend was also close to the position of the green line. We need to be careful at this position. There may be resistance, and the price will fall later.
So, we can see that after the halving of production, the uptrend close to the position of the green line has the risk of a short-term decline. Therefore, if Bitcoin falls later or falls below the position of the orange line, it may be a very important long position and buying point.
So, let's take a look at the current market of Bitcoin. As for the long term, my view is still the same. When the orange line crosses the green line, we will consider whether to close the long position at the top. As for the medium to short term, if we continue to go long on Bitcoin, I think the green line above has pressure. If it rises to the previous high, we need to be careful. If the price falls now, we should try to observe whether Bitcoin will return to the position of the orange line. Then we will look for more long positions at that time.
More strategies can be added to the live account.
Candlesticks are king, trends are emperor. I am Master Chen, focusing on BTC, ETH spot and contract for many years. There is no 100% method, only 100% follow the trend; daily updates on macro analysis articles and technical analysis review videos across the network.  Friendly reminder: Only the public account of the column (as shown in the picture above) is written by Master Chen. The advertisements at the end of the article and in the comments are not related to the author. Please be cautious in distinguishing between true and false. Thank you for reading.
免责声明:本文章仅代表作者个人观点,不代表本平台的立场和观点。本文章仅供信息分享,不构成对任何人的任何投资建议。用户与作者之间的任何争议,与本平台无关。如网页中刊载的文章或图片涉及侵权,请提供相关的权利证明和身份证明发送邮件到support@aicoin.com,本平台相关工作人员将会进行核查。


