Yesterday morning, stimulated by the minutes of the Federal Reserve meeting, Bitcoin saw a strong rebound. The daily chart turned bullish, breaking free from the recent bearish trend. From the perspective of the daily candlestick pattern, the large bullish candle just managed to recover the previous day's large bearish candle, but without engulfing it. Combined with the overall rebound in the morning, the retracement seen yesterday indicates a continuation of the uptrend, following the trend pattern. Although the price ultimately closed lower yesterday, the long positions mentioned in the morning article perfectly captured the entry point at the low and yielded a profit of over a thousand points. The decline mainly occurred in the latter half of the day. Although the daily chart closed lower, it was actually a form of adjustment. Since it's an adjustment, whether the next move is up or down will depend on whether the intraday retracement support point from the morning is broken.
In the short term, there was a bottoming rebound in the morning, with the lowest point testing around 64500, but the main support is concentrated around 65000. This position is the key dividing point for today's daily chart, and short-term trading may revolve around this level. The resistance above is the 68000 level that was repeatedly emphasized yesterday. If the daily chart can turn bullish and stabilize successfully during the day, it will establish the conditions for a second uptrend after the pullback from the peak. In the morning, the price was under pressure at the 66000 level, and the intraday movement will depend on this level. Intraday trading should primarily focus on short positions, and two positions can be set up: first, at the 66000 level, and second, at 67000.
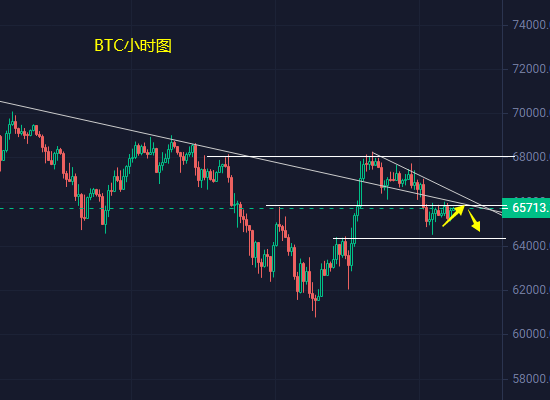
Short-term rebound: Short at 66000-66500
Ethereum, overall, appeared to be in a phase of adjustment yesterday. The daily chart closed with a doji candle, also forming an adjustment pattern. However, this adjustment pattern still needs to be complemented by today's daily chart movement to judge whether the trend will be bullish or bearish. The most critical resistance above for Ethereum is at the 3550 level. This level was attempted to be broken through multiple times yesterday but failed to stabilize effectively, leading to the subsequent decline. The retracement point in the morning was around the 3410 level, which is also the short-term dividing line for long and short positions intraday. Intraday trading should initially focus on short positions around the 3550 level, with a change in strategy if there is a breakthrough and stabilization.
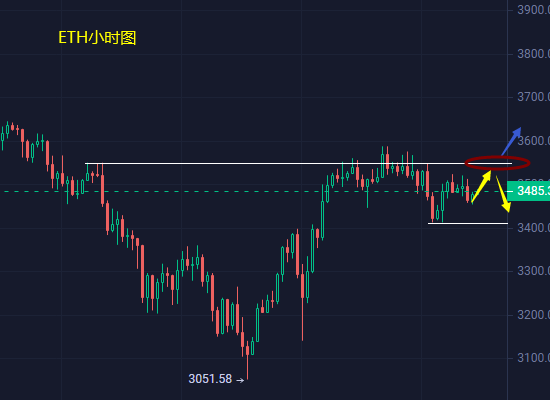
Short-term rebound: Short at 3550
This article is an original work by the author Xiaofenglunbi. The above analysis is only a personal opinion and is for reference only. Investment carries risks, and entering the market requires caution. Please indicate the source if reposting! For more analysis and recommendations, follow the public account: Xiaofenglunbi.
免责声明:本文章仅代表作者个人观点,不代表本平台的立场和观点。本文章仅供信息分享,不构成对任何人的任何投资建议。用户与作者之间的任何争议,与本平台无关。如网页中刊载的文章或图片涉及侵权,请提供相关的权利证明和身份证明发送邮件到support@aicoin.com,本平台相关工作人员将会进行核查。


