3/20/AICoin Community: ETH Will Rebound When Oversold; Where Are the Short-term Opportunities?
Course: Two Days, Two Orders, Capturing 8x Returns in the Vegas Tunnel!
The live broadcast room shares various mainstream technical indicators and their application methods, as well as the analysis of the technical trends of the day.


[ETH/Daily Chart]
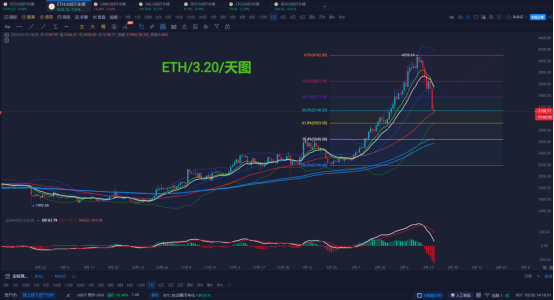
ETH/Daily Chart Technical Trend Analysis: After rising for 50 days, it fell by 50% in 7 days; this is a unique characteristic of the cryptocurrency market. Since Ethereum fell from its high, it has only taken 7 trading days to erase half of the entire bull market. Yesterday's price fell to the 50% Fibonacci retracement level in the form of a large bearish candle; intraday, it slightly broke below 50% [3150] and pierced through the 50MA, currently trading near 3150. The short-term decline has entered a severely oversold area. In the short term, there are many potential important support levels at Fibonacci 50%-61.8% [3150-2900], and the 50MA and the lower Bollinger Band are not far away at [2950], with the expectation of a bullish counterattack at any time. If the decline stops clearly today, then there will be a rebound in the future, but the strength needs to be continuously observed because the current downtrend of the MACD is still quite strong. Perhaps after the decline stops, it will still need to oscillate at a low level for several days, waiting for the MACD energy column to start converging before showing a better performance in the bullish counterattack.
For specific details of the intraday operation strategy, refer to the following 1-hour chart.
[ETH/1H Chart]
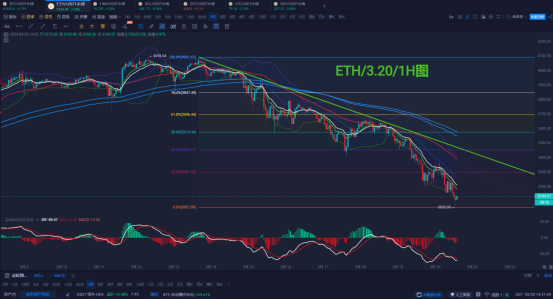
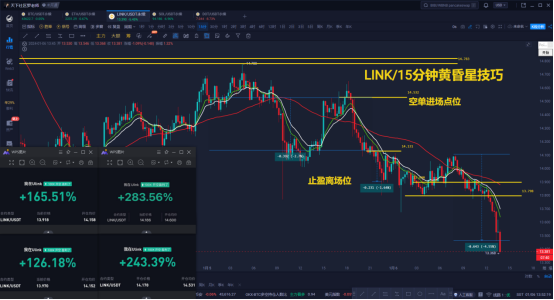
ETH/1H Technical Trend Analysis: In the short term, after the price effectively fell below the Vegas Tunnel on March 14, at least four resistance points for short-term bearish opportunities have appeared; 3900--3780--3650-3350 are all ideal areas for shorting the rebound. In the past two days, we have captured short opportunities for DOT and LINK based on the bearish indication of the Vegas Tunnel, with returns reaching around 8 times, or 800%. During today's live broadcast, we will focus on sharing the intraday trading opportunities for Ethereum. There is an expectation of a bottom around 3050 in the short term, and there will be a rebound in the European session; the target is 3300, 3350, or even 3400. You can try bottom fishing with a light position and set a stop loss at 3030. After the rebound, if a topping pattern appears, you can enter a short position; the expected price level for the topping pattern refers to the above rebound target. More details are welcome to be discussed and learned in the live broadcast room!

Recommended Strategy [Oscillation Decline; Short]
Support 3050-3000 / Resistance 3300-3350
Tencent Meeting ID: 565-877-8060
Seven live broadcasts daily: 14:00-21:30 uninterrupted


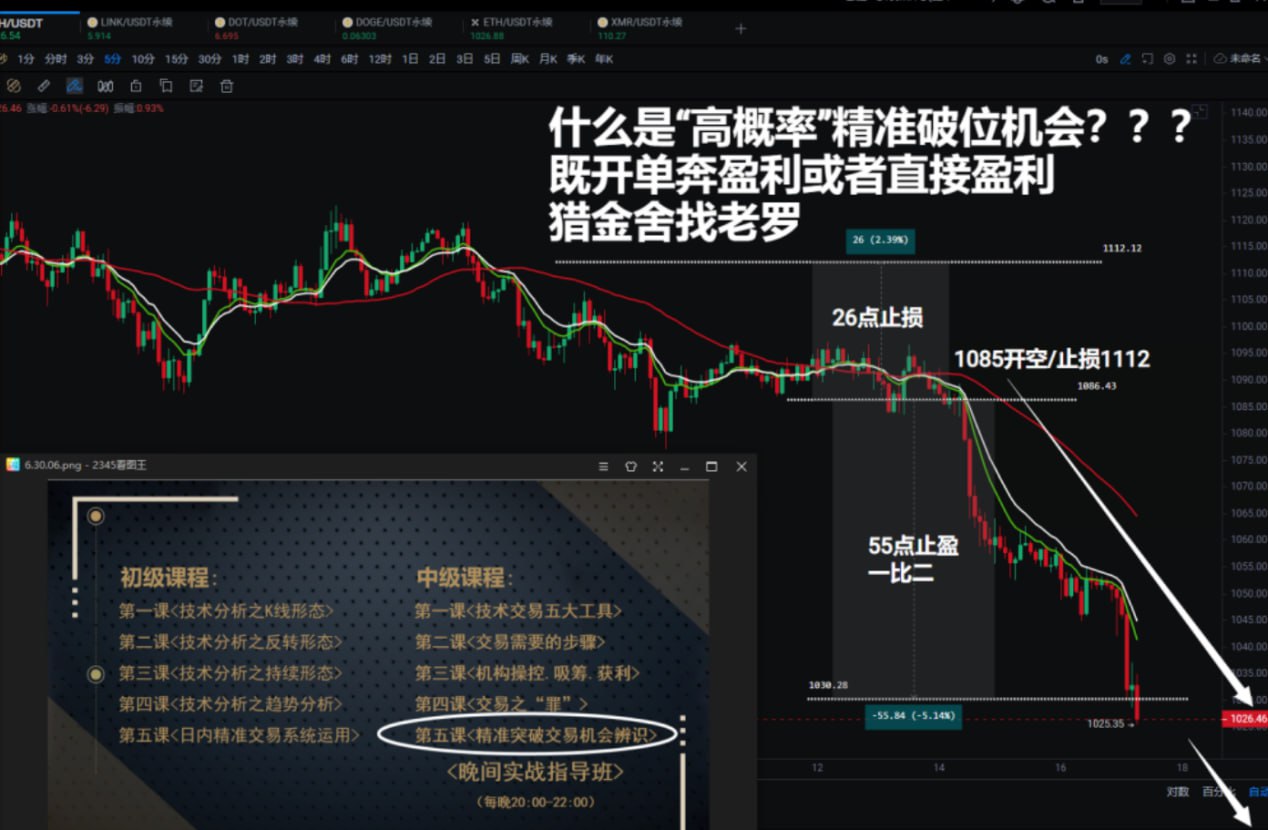
[Liejinshe] What Can You Get from the Elite Class?
1. Get the midday video at the first time // 2. Get the market's intraday views at the first time
3. Get short, medium, and long-term strategies at the first time // 4. Track and guide the strategy throughout
5. Have the opportunity to participate in exclusive midnight battles // 6. Have the opportunity to participate in million-dollar courses
[Efficient. Accurate. Capturing Breakthrough Trading Opportunities]

2022 Annual Strategy Guidance Record
February-December 2022 /// 10 wins 1 loss
February complete / return rate 2500% /// March complete / return rate 2500%
April complete / return rate 2626% /// May complete / return rate 3698%
June complete / return rate 3081% /// July complete / return rate 7033%
August complete / return rate 4694% /// September complete / return rate 5046%
October complete / return rate 1438% /// November complete / return rate 2362%
December complete / return rate -474% ///
February-December 2022 complete total return 34504%
Single margin of 100U * 34504% = 34504U guaranteed for each strategy // There is evidence for each strategy, traceable to the start time, year, month, day, hour, minute, and second, with graphic and textual records. Interested individuals can scan the code to join the group for verification!!


免责声明:本文章仅代表作者个人观点,不代表本平台的立场和观点。本文章仅供信息分享,不构成对任何人的任何投资建议。用户与作者之间的任何争议,与本平台无关。如网页中刊载的文章或图片涉及侵权,请提供相关的权利证明和身份证明发送邮件到support@aicoin.com,本平台相关工作人员将会进行核查。


