Click to watch the video: Master Chen's 3.20 Video: Where is the Support for the Drop Before the Halving? Has the Market Stopped Falling?
Yesterday's nearly 10% plunge in Bitcoin also led to a significant retracement of our long positions. Since I choose to hold long-term profits, I still prefer to hold medium to long-term long positions. For friends who are shorting in the short term, they are also asking whether they should close their short positions or modify their defensive strategies. We will also discuss whether Bitcoin has stopped falling later.
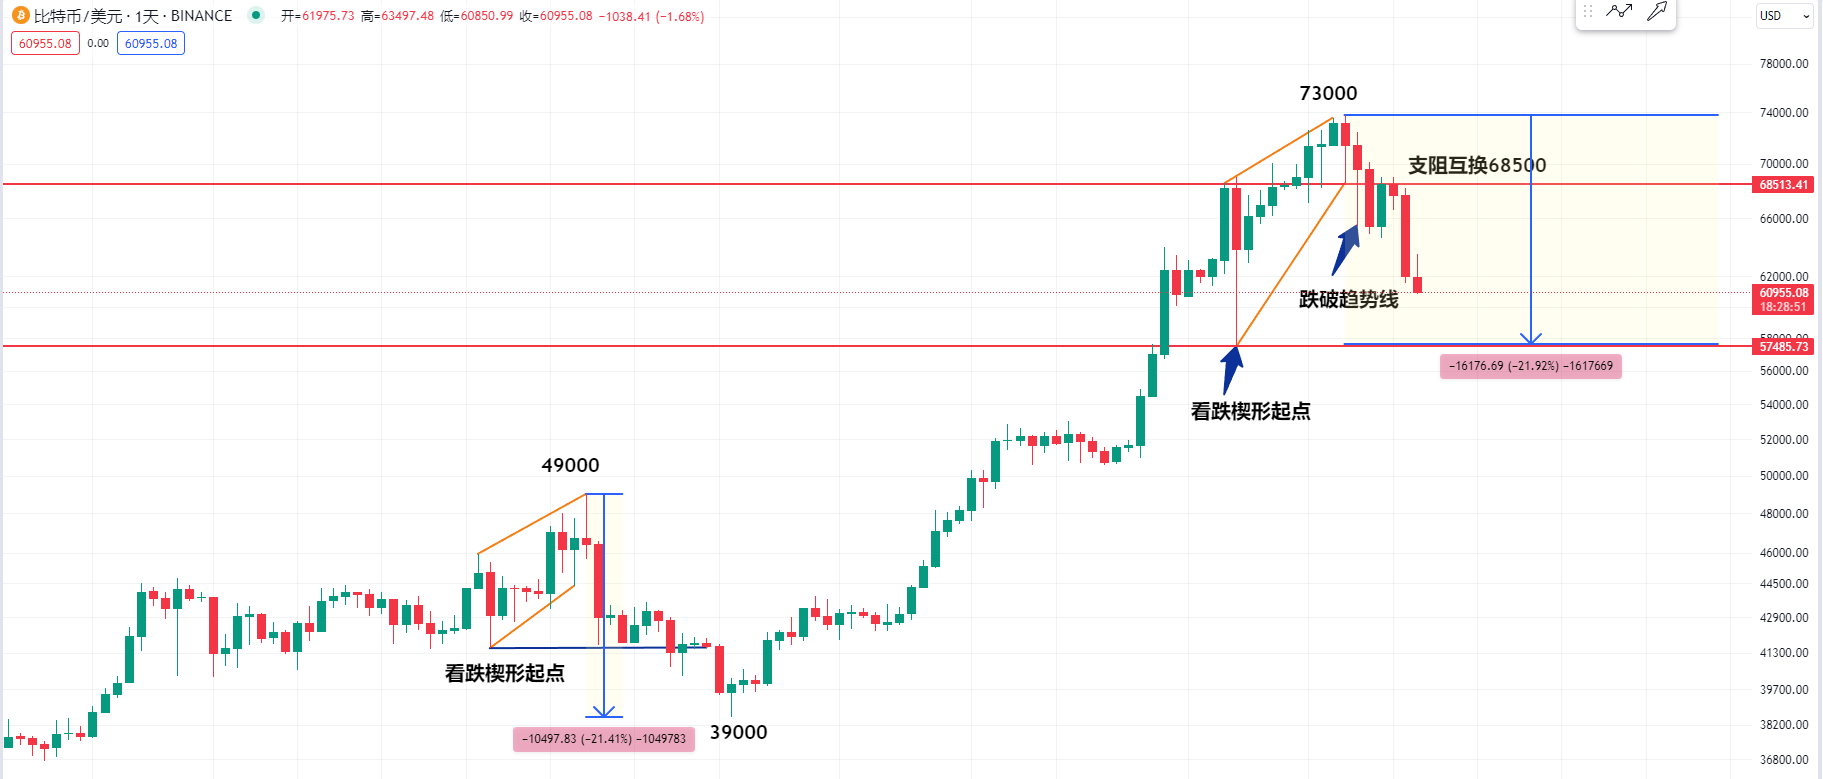 First, let's take a look at the Bitcoin daily chart. About a week ago, Bitcoin was at a high point of 73,000. I also reminded everyone in the video that Bitcoin had a bearish wedge pattern. There was a support-resistance swap around 68,500. In the past few days, friends who had short positions asked me whether they should close their positions.
I think you can close a portion of your position and leave some to see if Bitcoin will reach even lower lows. I will also tell you later where to look for defensive and profit-taking positions for short positions. After this recent drop, based on previous experience, if we follow the bearish wedge pattern, the price may return to the starting point.
Including before, we can observe that at the high point of 49,000, when shorting, the price returned to that level and even fell below it. So let's take a look at when Bitcoin broke through this bearish wedge pattern at 68,500. I believe this is a pressure zone because it has already broken through this trend line at this level. After breaking through, the return may confirm whether the breakthrough is valid. Ultimately, the two bullish resistance candlesticks did not rise. So if you have a short position at this level, you can also close a portion of your position now.
Because if we break through the low point of 59,000 from the high point, there isn't much room left to reach 59,000. It's a drop of nearly 20% to that level.
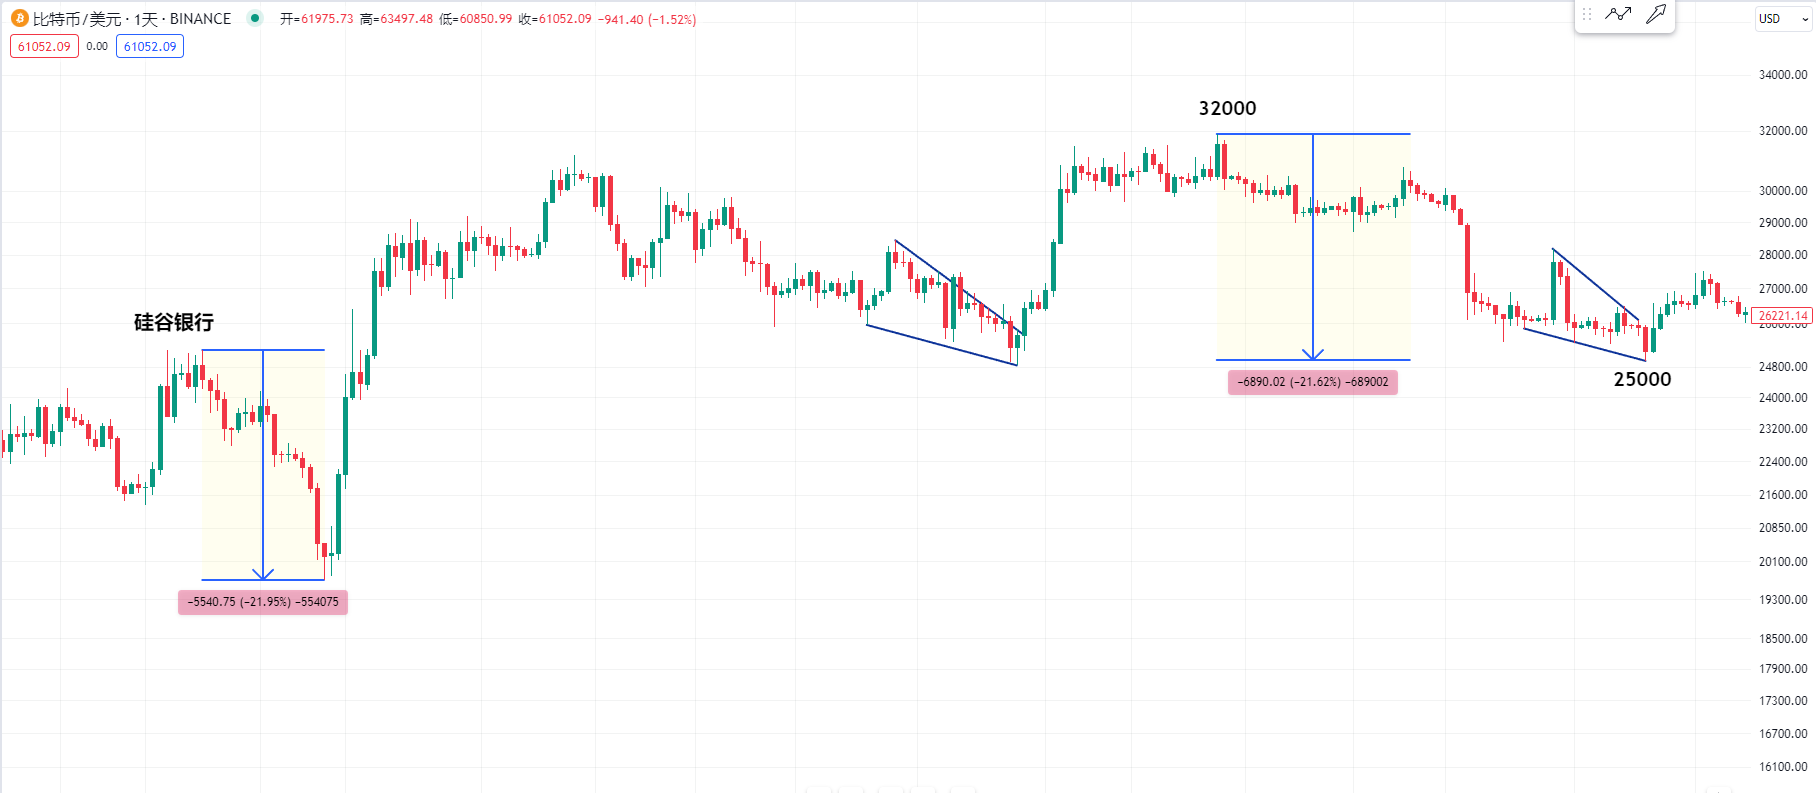 We can also observe the retracements of Bitcoin after the previous few waves of increases. I have mentioned before that each retracement of this bull market wave is generally around 20%. For example, from the high point of 32,000 to the low point of 25,000, the retracement was also around 20%. Even at the position of the collapse of the Silicon Valley Bank, the retracement space was also close to 20%.
Or we can observe the retracement space from the previous high point of 49,000 to the low point of 39,000, which was also close to 20%. So I believe that the retracement space from the current high point to this level is also close to 20%. Therefore, I think it's reasonable to close a portion of your short position at this level, or wait for further decline before closing a portion. It's also possible to see if there will be even lower lows.

Next, let's take a look at the Bitcoin weekly chart because we all know that Bitcoin is about to face the halving of production, which will be on April 19, 2024. We can also look back at history. In May 2020, before the halving, no matter how high the bull market rose, it did not break the historical high of 2017. Similarly, in July 2016, before the halving, the price did not break the previous high of 2013.
The current environment is different from before. Compared to the previous halving periods, the environment before and after the Bitcoin halving is very favorable, including the Fed's interest rate cuts and the upcoming halving. But we also need a reference point to judge whether it will continue to decline before the halving or how far it is from the historical high, which is currently 73,000. Based on historical data, the distance from the previous high before the halving is generally around 50%.
We can observe that it's about 50% from the halving in May 2020 to the previous historical high in 2017, based on the weekly closing price. Similarly, we can observe that it's close to 47% from the halving in July 2016 to the previous high in 2013. Or we can observe that it's close to 60% from the halving in November 2012 to the previous historical high in 2011.
So after observing several halving periods in Bitcoin's history and the distance from the historical high, there is generally a 50% difference. I think the current environment is different, so let's take a value. Is it possible to drop by about 30% from the high point of 73,000? If it breaks through 59,000, it's about 20%. If it goes down by 30%, we can observe that the consolidation area on the weekly or daily chart of Bitcoin is around 52,000. Will there be a support zone at this level?
If it really drops to this level, we need to focus on observing. At that price, there may be an opportunity for medium to long-term long positions. Of course, I can't say for sure about other declines. The worst-case scenario is whether it will continue to decline.
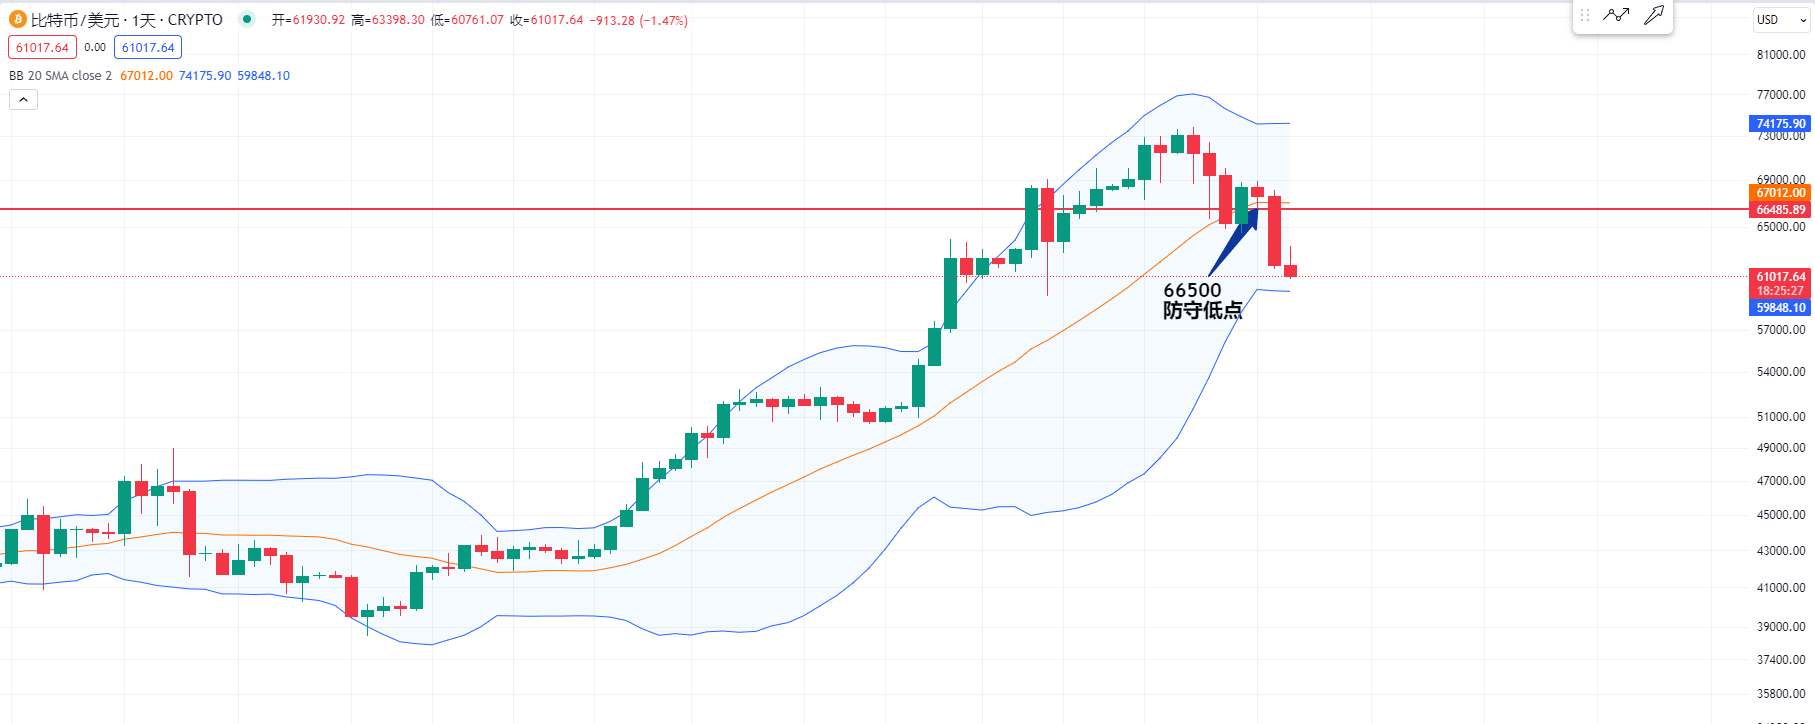 Next, let's take a look at the Bitcoin daily chart. If you are holding short positions at the current level, it's also possible to close a portion of your position because the lower band of the daily Bollinger Bands is very close to the low point. There isn't much room left. You can close your position, or you can leave half. For defense, we can see that the K-line that fell yesterday broke the low point of the K-line that fell the day before, near 66,500. I think this low point of 66,500 can be used as a defensive position for everyone who is shorting. Then we can see if there will be even lower lows.
For more strategies, you can join the live trading.
Candlesticks are king, trends are emperor. I am Master Chen, focusing on BTC and ETH spot and contract trading for many years. There is no 100% method, only 100% trend following. I update macro analysis articles and technical analysis review videos daily across the web. _ Friendly reminder: Only the public account of the column (shown in the image above) is written by Master Chen. The advertisements at the end of the article and in the comments are not related to the author. Please be cautious and discerning. Thank you for reading.
免责声明:本文章仅代表作者个人观点,不代表本平台的立场和观点。本文章仅供信息分享,不构成对任何人的任何投资建议。用户与作者之间的任何争议,与本平台无关。如网页中刊载的文章或图片涉及侵权,请提供相关的权利证明和身份证明发送邮件到support@aicoin.com,本平台相关工作人员将会进行核查。


