Click to watch the video: Master Chen's 3.19 Video: Picycle Indicator Buying Point Analysis - How Much Time is Left at the Market Top?
In the video analysis I released yesterday, I mentioned that in the short term, I think Bitcoin will be bearish. Some of my fans and friends are concerned whether the bull market for Bitcoin has ended. I have expressed my clear views on this issue in the article I updated on my public account today.
In today's video analysis, we will discuss the fact that the bull market for Bitcoin has not ended. There will be even more crazy bull markets ahead. Therefore, I am still holding the profits from going long below $20,000 last year. Today, we will also discuss some knowledge about the charts.
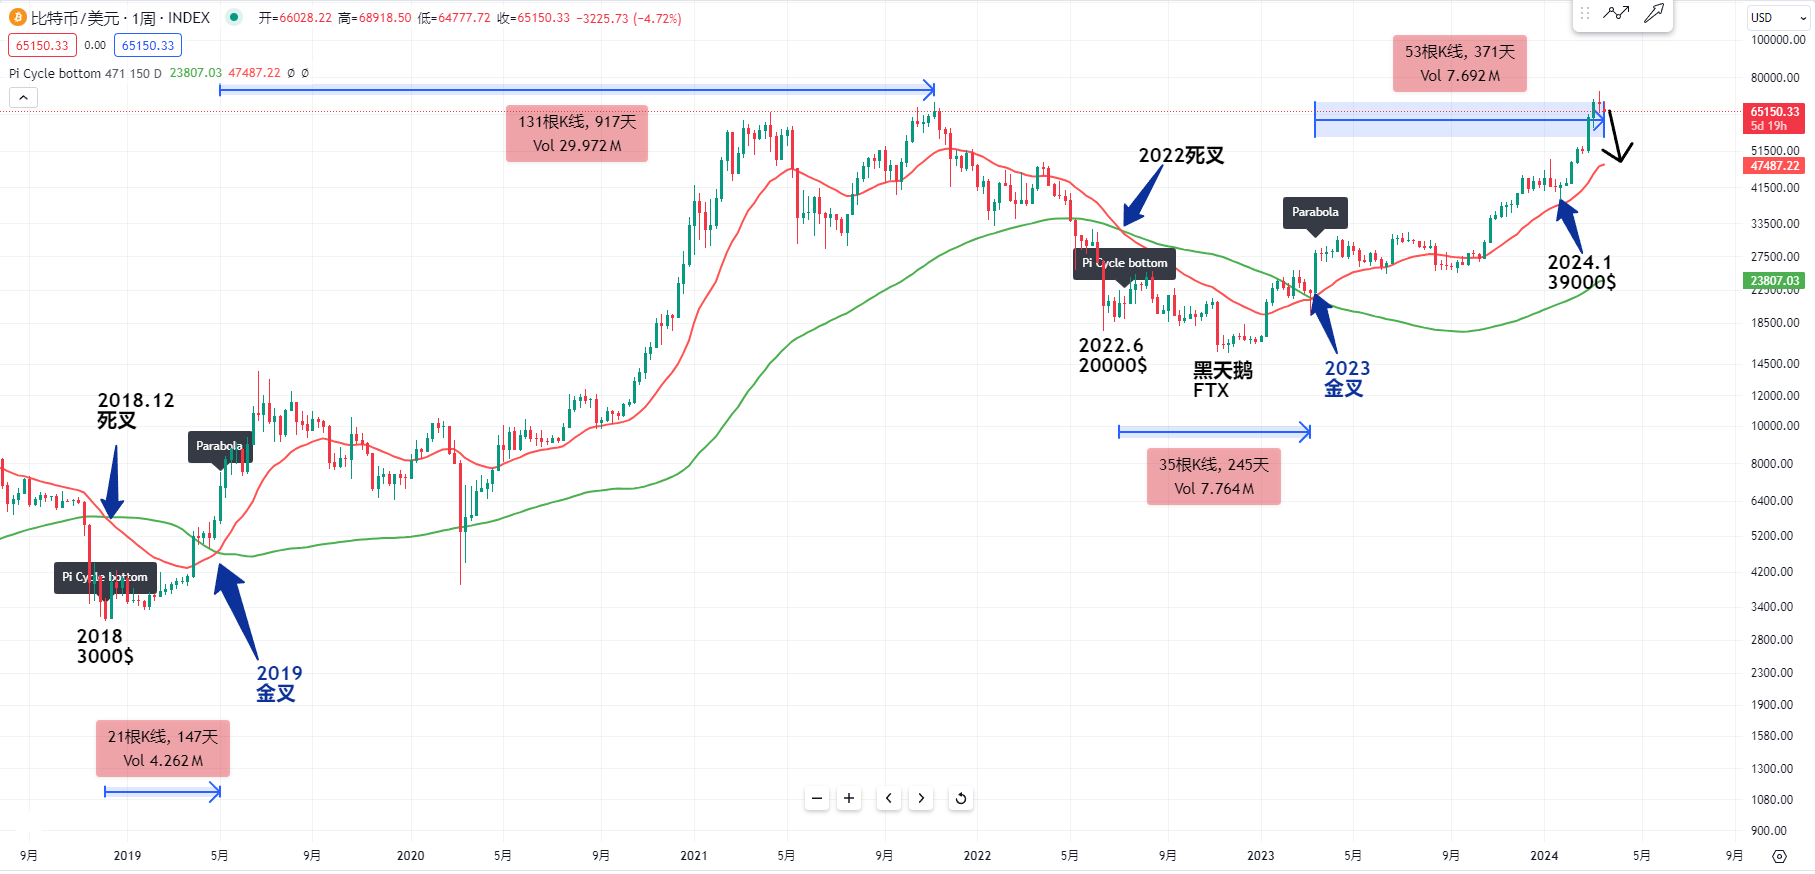
First, let's take a look at the weekly chart of Bitcoin. There is a legendary indicator called the Picycle indicator. My old fans know that I have mentioned this indicator in previous videos. We can observe that since June 2022, when the price of Bitcoin dropped to $20,000, I also mentioned in last year's video that Bitcoin could start bottoming out below $20,000. According to historical experience, many indicators tend to be oversold in the bottom area. This Picycle indicator has a legendary history as well.
As long as the red line crosses below the green line, it is possible that it's the bottom. When Bitcoin was at the bottom of $20,000, I mentioned in the video that it could be a good time to bottom fish. However, at that time, many detractors left mocking and insulting comments, which is why I decided to close some platform comment sections. Of course, that's not the main point.

The main point is to pay attention to the Picycle indicator in 2019. In December 2018, the red line crossed below the green line, and $3,000 was a very important bottom for Bitcoin at that time. We can also observe the Picycle indicator in 2015. When Bitcoin dropped from its high point to around $160, the red line crossing below the green line was a very important bottom in 2015. So, looking back at several very important bottoms in history, the Picycle indicator crossed at this position in 2015, and then it crossed back up to this position at the bottom, taking about 260 days.
Or Bitcoin simply started a very crazy bull market rise. In 2019, we can also observe the bottom crossing to the golden cross at this position. The time was relatively short, about 150 days. This time, we can observe Bitcoin continuing to cross in 2022 to 2023, and the time is very similar to the bottom in 2015, about 250 days. Looking back now, if there hadn't been the black swan event of the FTX exchange collapse in 2022, and Bitcoin had dropped to $15,000, I believe that would have been a very important bottom. From the golden cross to now, I think it's still too early to talk about the end of the bull market, because historically, whenever the Picycle indicator had a golden cross, in 2019, it took about 900 days for Bitcoin to rise to the top of $69,000.
We can also observe that in 2015, the Picycle indicator had a golden cross, and it took about 800 days for Bitcoin to rise to the top. We can also observe that during Bitcoin's bull market from 2015 to 2017, the Picycle indicator did not always rise like this. Every time it reached the Picycle indicator's red line, including when Bitcoin's production halved at this position, there were multiple times when the price continued to pull back to the Picycle indicator's red line, which is a very important point to continue to go long.
So let's observe the current position of Bitcoin. In January this year, it dropped to around $39,000, very close to the red line of the Picycle indicator. So this time, if the price rises, there may be a short-term 10% drop. Friends who have short positions need to consider whether to close their medium and long-term short positions.
Of course, it's not certain whether the next long position will drop to the red line of the Picycle indicator. If it's in a consolidation structure, the Picycle indicator may also move up at a certain speed every week. So let's observe if Bitcoin will continue to fall. Then we will observe whether there is still a point to continue to go long near the red line of the Picycle indicator.
Considering the time now, the bull market for Bitcoin may have only gone halfway. From the golden cross in March 2023 to now, it's only been about 370 days, with more than half of the time left, maybe 400 days. It's possible that if Bitcoin has a medium-term adjustment at this position, I think we can find opportunities to go long in the medium and long term, or look at the top of Bitcoin's future bull market after 400 days, and see if it will enter a bear market at that time.

Now let's take a look at the daily chart of Bitcoin. Because I mentioned in the video yesterday that there is a very important support and resistance conversion position around $68,500. Let's pay attention to it. There is still a very important resistance K-line for the bulls at this position.
If Bitcoin can continue to rise at the current position, I think we shouldn't look at the moving average in the short term, because the green 20MA has already been broken. So if it wants to maintain its strength, the low point of this resistance K-line at $64,500 should not be broken in the short term. This point was also mentioned in my article today.
For more strategies, you can join the live trading.
K-line is king, trend is emperor. I am Master Chen, focusing on BTC and ETH spot contract for many years. There is no 100% method, only 100% trend following. I update macro analysis articles and technical analysis review videos daily on the entire network. Warm reminder: Only the official public account (shown in the picture) is written by Master Chen. The advertisements at the end of the article and in the comment section are not related to the author. Please discern carefully. Thank you for reading.
免责声明:本文章仅代表作者个人观点,不代表本平台的立场和观点。本文章仅供信息分享,不构成对任何人的任何投资建议。用户与作者之间的任何争议,与本平台无关。如网页中刊载的文章或图片涉及侵权,请提供相关的权利证明和身份证明发送邮件到support@aicoin.com,本平台相关工作人员将会进行核查。


