Click to watch the video: Master Chen's 3.13 Video: Random RSI Indicator to See the Next Buying Point for Bitcoin and Dogecoin, Short-term Support for the Market and Dogecoin?
Today in the video, we will discuss where Bitcoin and Dogecoin might fall to, as some friends have recently asked me about this. It seems that many people are still looking for long or medium-term buying positions in Bitcoin or Dogecoin contracts. Later, we will share some knowledge from the charts, especially how to determine the next buying point for long positions.
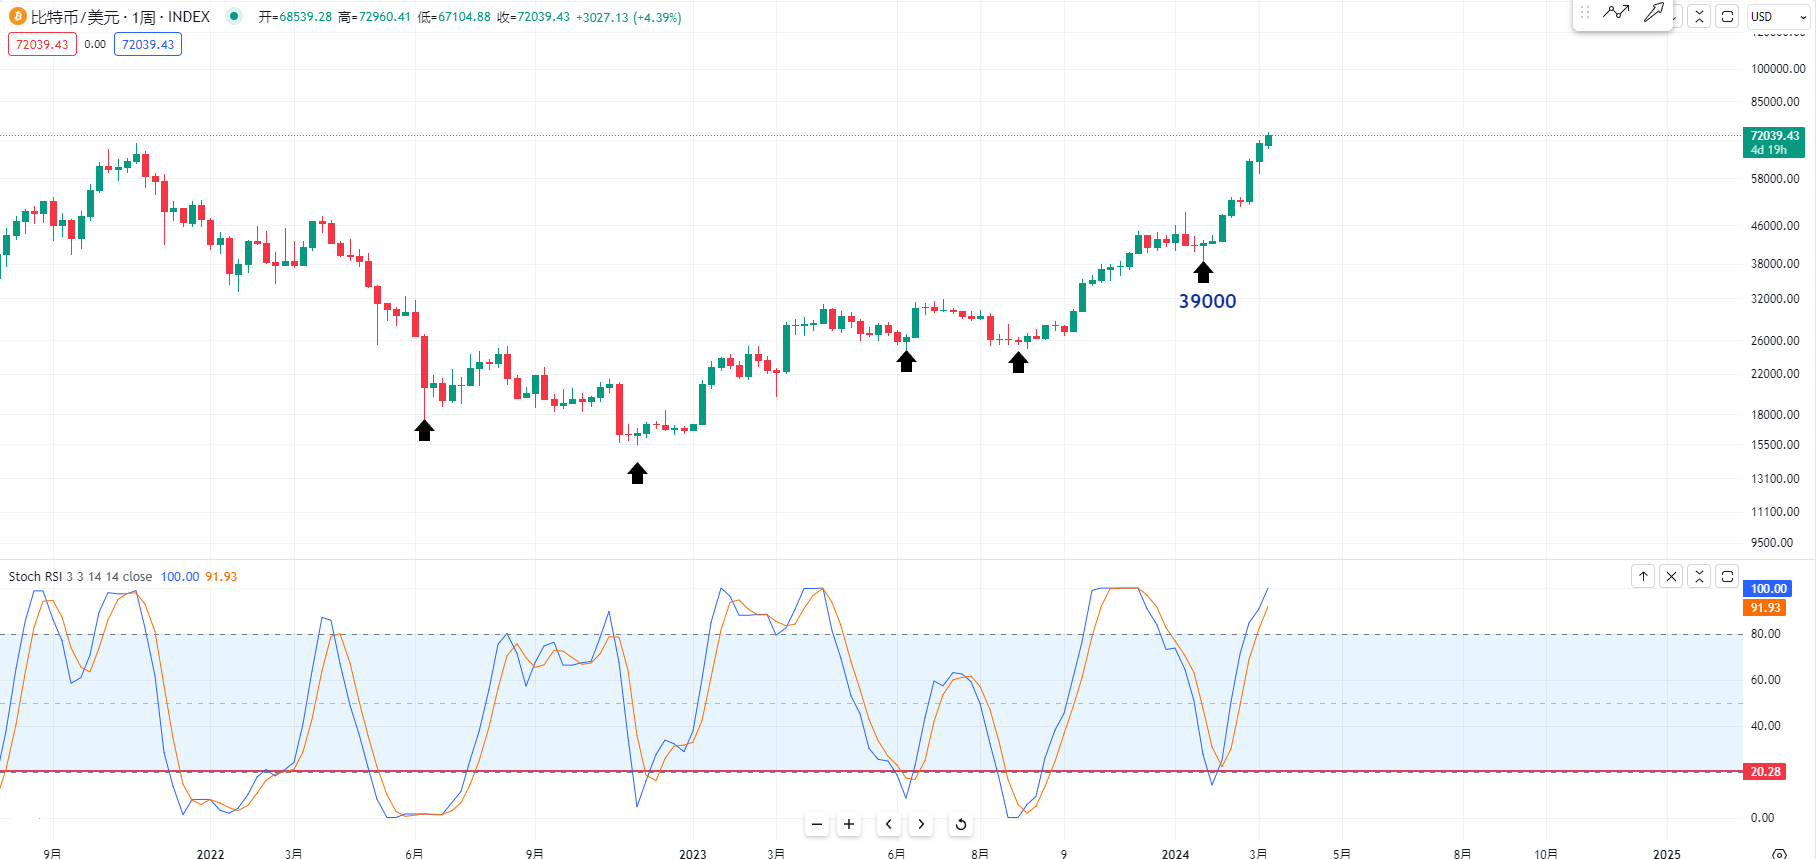
First, let's take a look at the weekly chart of Bitcoin. We can see that the stochastic RSI indicator at the weekly level is also very accurate. The low points marked by the arrows above are all around 20, which could be very important buying points.
For example, at the low point of 39,000, the stochastic RSI indicator was also around 20, making it a very important buying point. We can observe that after these low points, there were significant profits. Therefore, based on the stochastic RSI indicator of Bitcoin in the past one or two years, we can observe that as long as the indicator value is around 20, it could be a very important buying point.
The premise is that you must have sufficient awareness that Bitcoin is definitely in a bull market. I still believe that Bitcoin is still in a bull market, but the recent RSI indicator may indicate the possibility of the next buying point if it really comes to around 20.
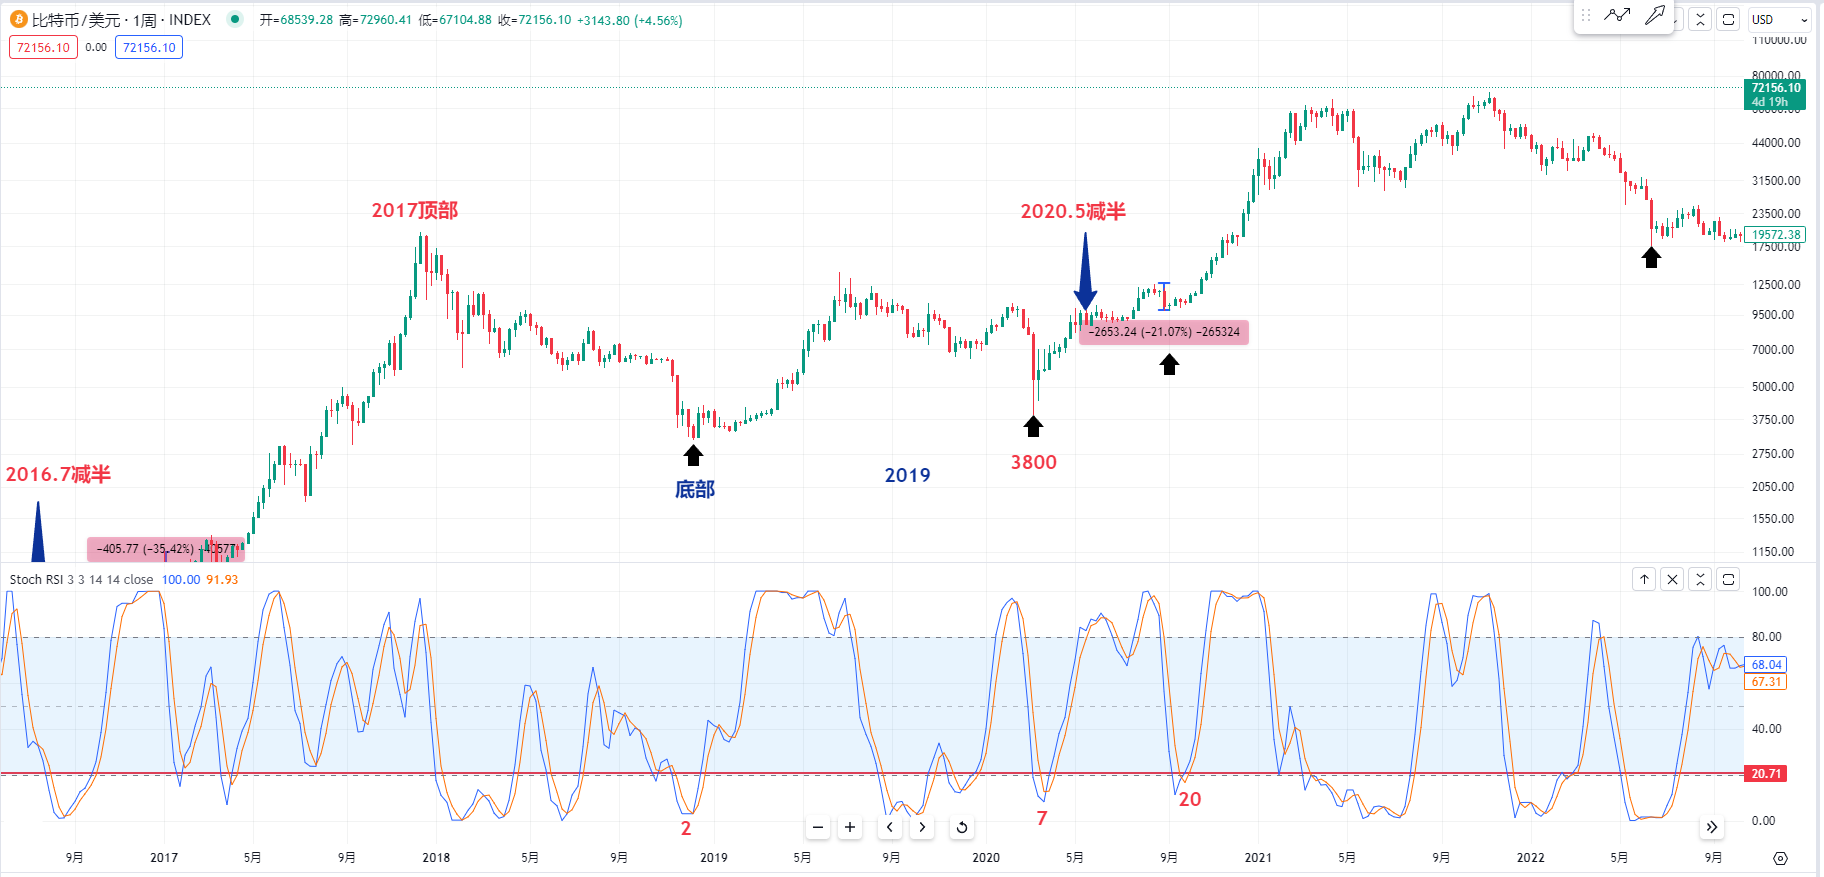
We can also look at Bitcoin in 2019, when it plummeted to the bottom. The stochastic RSI indicator also dropped to below 20, even close to 2, which could be a very important bottom. Similarly, we need to consider if there are any buying points ahead. After Bitcoin rose from the low point of 3,800, it rose to a high of 69,000. We can observe that after the halving in May 2020, the stochastic RSI indicator was also around 20, which was a very important buying point.
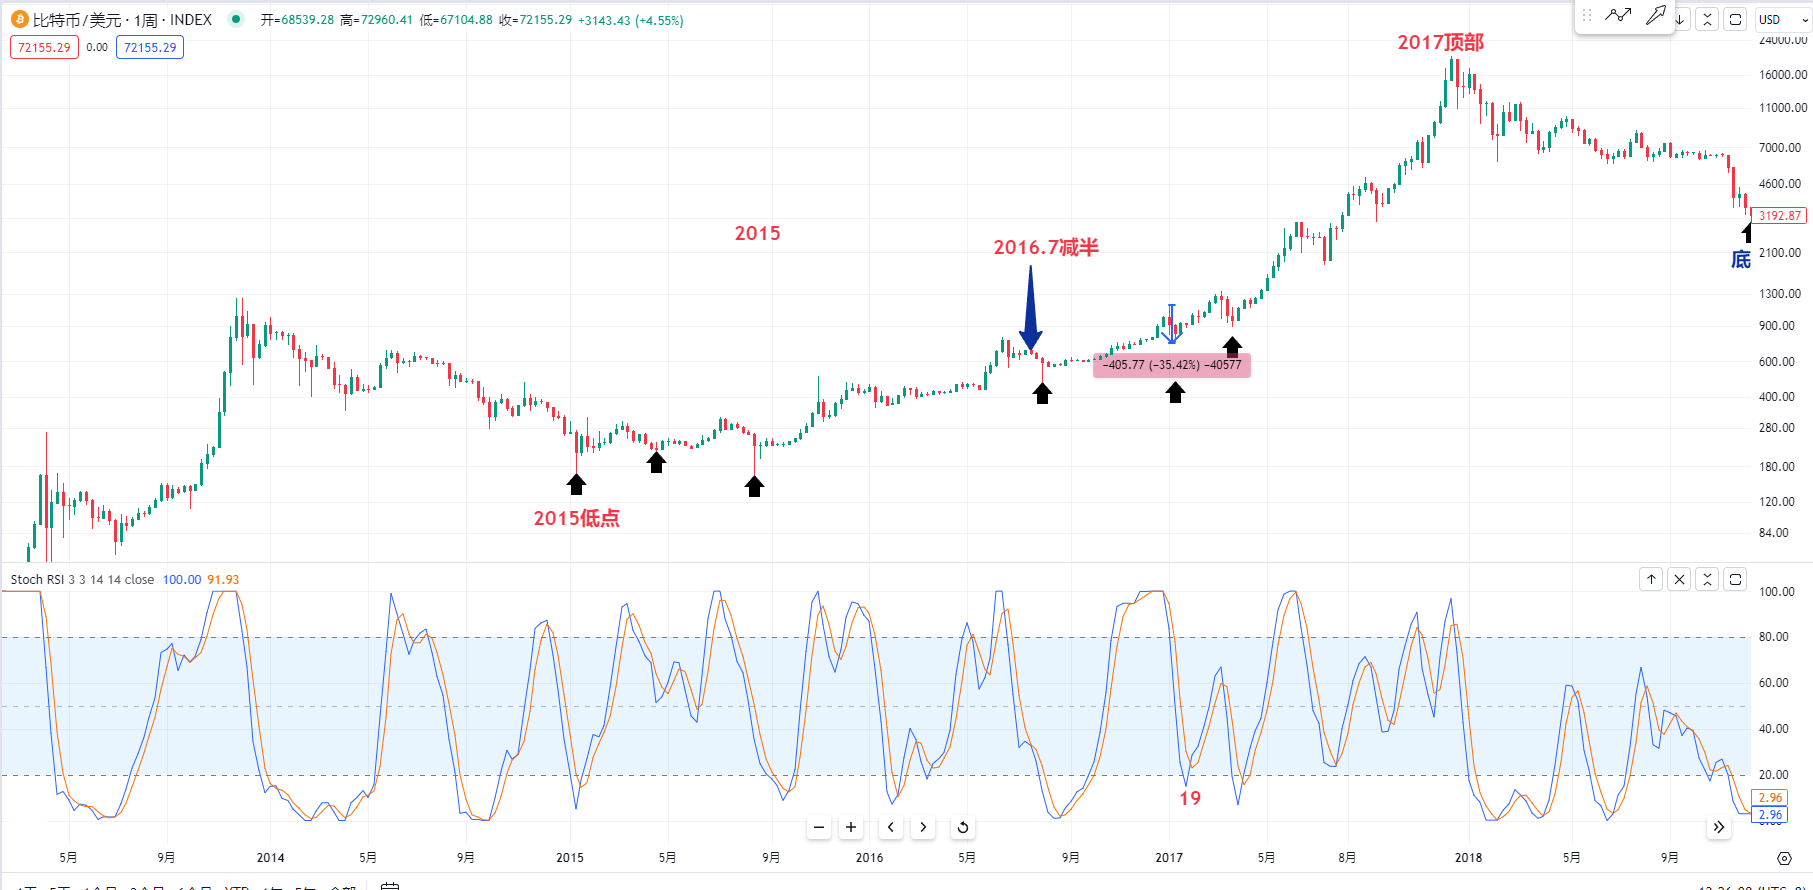
We can also look at the bull market of Bitcoin starting from the bottom in 2015, which also had many buying points. At the bottom in 2015, the stochastic RSI indicator came close to 20, which is also a very important buying point. However, after the bull market rose to the top in 2017, there were many stochastic RSI indicators at the weekly level.
Around July 2016, Bitcoin also halved its production. We can see how many buying points there were after Bitcoin's rise, or after a brief decline, which was about 30%. Then we can see that the RSI indicator was also close to 20, which is a very important buying point.
As long as there is a drop of more than 20%, we can refer to the stochastic RSI indicator below for a very important long opportunity.
But currently, the stochastic RSI indicator is also at a high point. We will continue to observe whether Bitcoin will really consolidate at this level in the future, or whether the stochastic RSI indicator still has the possibility of coming close to 20, which can still be a simple reference for buying points.
Because there has been no halving yet, after the halving in history, there may still be buying points near 20 in the stochastic RSI indicator. We will see if there are any more buying points appearing at that time.
So now, to observe where Bitcoin might fall, I'm not good at making predictions. It's hard to say whether there will be a pullback now. I just hope it can rise to a higher position soon, and then we can close some of the long-term positions.
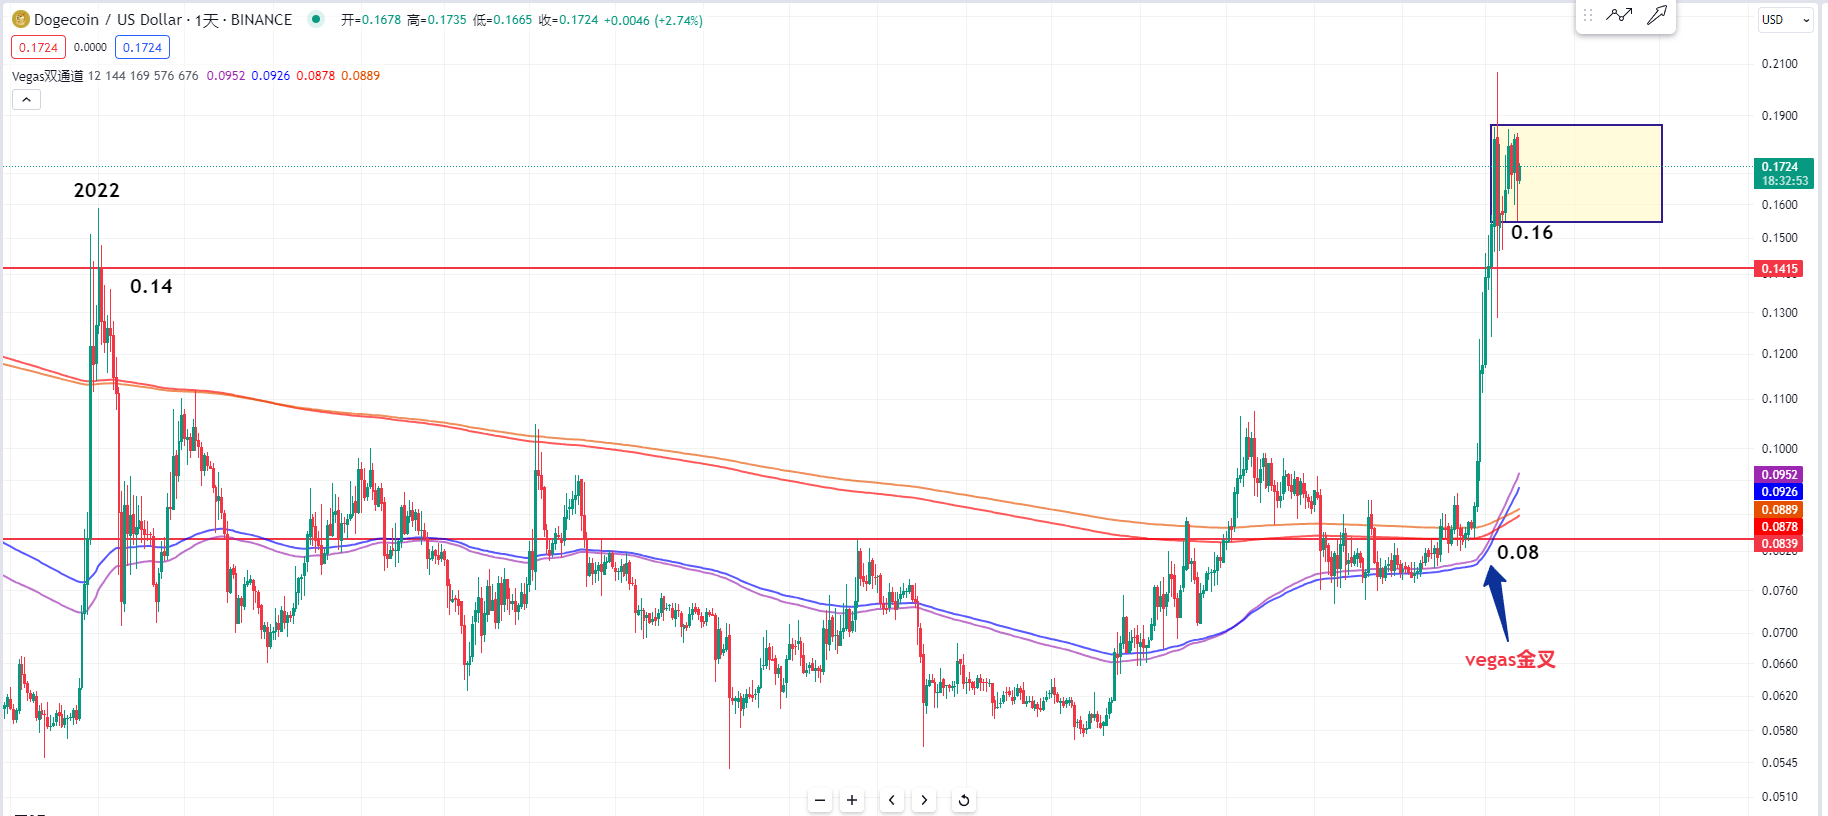
Let's take a look at the daily chart of Dogecoin. Starting from around 0.08, the recent rise has just begun, as the Vegas indicators 144 channels and 575 676 channels have not yet had a golden cross at this level.
Once this golden cross appears, everyone needs to pay attention. It's not that after the cross appears today, there will be a death cross tomorrow. It takes several years for a golden cross to appear. After rising to a high position, some friends are asking whether to chase more after it rises too much, or if there are lower low points.
If you have just entered the market, I can tell you some support levels for Dogecoin in the short term. We still need to observe whether this position of 0.16 cannot be broken. The previous few long lower shadows are also relatively deep.
We can observe the current position of the Vegas golden cross. I personally think it may still consolidate at this level, and it may not necessarily fall below 0.16. But if it is really broken, as I mentioned in the previous video, when Dogecoin rose in 2022, the real prices of these high positions will be the next support, which is about 0.14.
For more strategies, you can add a real account.
Candlesticks are king, trends are emperor. I am Master Chen, focusing on BTC and ETH spot and contract for many years. There is no 100% method, only 100% trend following. I update macro analysis articles and technical analysis review videos daily across the web.  Friendly reminder: Only the official public account (shown in the picture above) is written by Master Chen. The end of the article and other advertisements in the comments section are not related to the author. Please be cautious in distinguishing between true and false. Thank you for reading.
免责声明:本文章仅代表作者个人观点,不代表本平台的立场和观点。本文章仅供信息分享,不构成对任何人的任何投资建议。用户与作者之间的任何争议,与本平台无关。如网页中刊载的文章或图片涉及侵权,请提供相关的权利证明和身份证明发送邮件到support@aicoin.com,本平台相关工作人员将会进行核查。


