Daily Sharing
It was another day of sideways fluctuations. After once again challenging 69,000, Bitcoin began a short-term flash crash, followed by a V-shaped sideways fluctuation. The pullback has not yet occurred, and it is uncertain whether it will move towards an upward extension. Let's see if it can break through around 68,000.
If it can provide a good pullback position, it should be entered promptly because the daily rebound of Bitcoin has not yet completed, and it is expected to surge above 70,000 again.
BTC Medium and Long Term
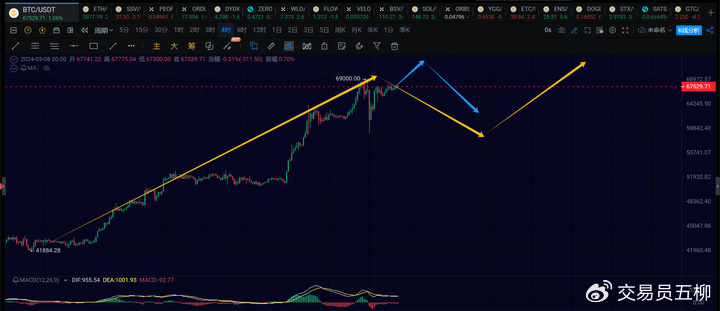
Daily Chart:
At the daily chart level, it is still running a rebound from 24,900, which has been extending upwards for 6 months. It has not ended yet and is expected to surge above 70,000, with a personal focus around 76,000.
For this daily uptrend to complete, at least a 4-hour pullback and a 4-hour rebound are needed, and it should reach the top-back of the MACD above the 12-hour level to have a chance of ending. So, there is no need to rush. Currently, there are no signs of a peak, so continue to be bullish and hold the spot.
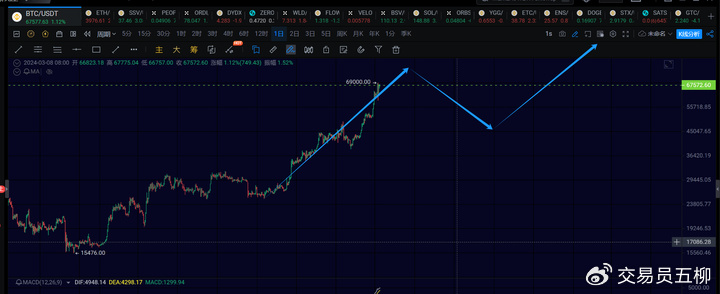
4-Hour Chart:
At the 4-hour level, it is uncertain whether a 4-hour pullback will occur, but there is a tendency for it. If a 4-hour pullback occurs, it may not go to a very low position, probably around 58,000. Then, it will go for a third 4-hour rebound to a new high above 70,000.
Of course, if it breaks through 68,000 again in the short term, it may continue to surge for a while, and then start a 4-hour pullback, as indicated by the blue arrows in the chart.
BTC Short Term
Due to the rapid changes in the market, this article can only make predictions based on the market changes at the time of publication. Short-term players should pay attention to the latest market changes and use this information as a reference only.
1-Hour Chart:
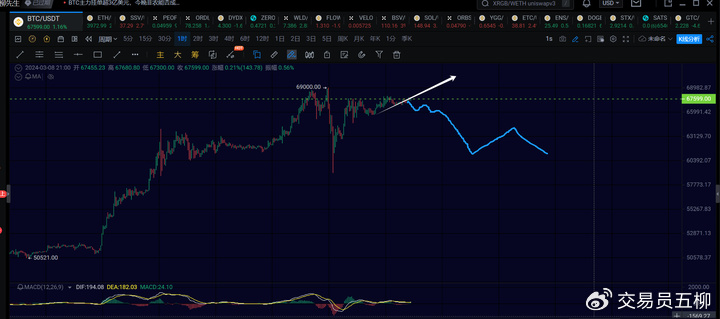
At the 1-hour level, it is unknown whether it will continue to surge to a new high of 69,000. Currently, the pullback has not been successful, so let's observe further. If it directly breaks through 68,000, it should surge to above 70,000 again, and then provide a new opportunity for a pullback. If it does not go up, it may oscillate and pull back to form a 4-hour pullback.
15-Minute Chart:

It continues to oscillate above 67,000, with a possibility of continuing to surge above 70,000+.
ETH

Ethereum is very strong, and there are no signs of the end of the uptrend at the daily chart level. It is expected to continue to rise, with a minimum target of around 4,200. If it breaks through, it will likely test around 4,800. If it rises at the weekly chart level, Ethereum has a chance to go above 10,000.

Ethereum continues to refresh its high points, and the 1-hour pullback has not occurred. If it continues to rise, it will be observed whether the 4,000-4,100 range can resist the 1-hour pullback. If it stays above 3,500 in the short term, then the 4-hour pullback will not be seen for the time being.
Trend Direction
Weekly Chart Level: Upward, currently continuing the rebound from 15,476, with attention to the subsequent daily chart situation for when it will end.
Daily Chart Level: Upward, very likely to go above 75,000.
4-Hour Chart Level: Upward, there is an expectation for further 4-hour pullback, but it is yet to be confirmed.
1-Hour Chart Level: Upward, no pullback is seen, so observe whether it will continue to reach a new high.
15-Minute Chart Level: Sideways fluctuation, pay attention to which side will break through first, between 65,000 and 68,000.
Feel free to follow my public account for discussions and exchanges:

The article is time-sensitive, so be cautious of risks. The above is only personal advice and is for reference only!
免责声明:本文章仅代表作者个人观点,不代表本平台的立场和观点。本文章仅供信息分享,不构成对任何人的任何投资建议。用户与作者之间的任何争议,与本平台无关。如网页中刊载的文章或图片涉及侵权,请提供相关的权利证明和身份证明发送邮件到support@aicoin.com,本平台相关工作人员将会进行核查。


