Tracking real-time hotspots in the currency circle, seizing the best trading opportunities. Today is Monday, March 4, 2024, and I am Yibo! We do not predict trades, but actually observe market fluctuations (narrowing, spreading), structure (market batch structure), emotions (external market US stocks, US dollars, etc.). As a trader, you (through trading) affect prices, and prices also affect your emotions and behavior.

Bitcoin's overall trend over the weekend was relatively small, fluctuating in the range of 61500-62500. Overnight, on Monday, the market decisively surged to nearly the previous high of 64500, with a daily large bullish candlestick closing higher with increased volume. After a long horizontal consolidation, there was a surge in volume, and after briefly retracing near 61300 over the weekend, it stabilized and continued to rise. The range shifted upward, accompanied by a unilateral surge in volume, indicating a strong bullish trend. The weekly and daily candlesticks closed strongly, and the previous volume was a consolidation of power. This week will continue to see a strong bullish volume, and the trend will continue to remain bullish. Looking at the 4-hour chart, there is a strong bullish trend with five consecutive bullish candlesticks, and the bullish trend is unstoppable. Congratulations to friends who followed this strategy last week. This one-sided market is not over yet, but the potential for further upward movement is a pleasant surprise.

This round of price increases is mainly influenced by the approval of spot ETFs for listing, the upcoming Bitcoin "halving" in April, the Fed's interest rate cuts, improvements in global macroeconomic expectations, and dynamics in the financial derivatives market. The entire market holds an optimistic attitude towards Bitcoin's future trend. In the short term, there is still a high possibility of further price increases for Bitcoin, and there will be some room for upward movement. In the long term, with the further expansion of Bitcoin consensus, more and more institutions and individuals will use it as an asset management and allocation tool, so its price will inevitably continue to rise in the long run. After the surge in volume, the closing price did not drop, and after today's market consolidation, it will continue to rise. It is expected that after the market consolidates, there will be a habitual surge, followed by a slight price correction, and then another upward movement, continuing this cyclical trend. From a technical perspective, the current 4-hour chart is oscillating near the upper Bollinger Band, and the short term is entering a period of correction. The trend of breaking through the high remains unchanged. In the short term, it is entering a period of correction. We previously treated the retracement as a correction, and the current pullback and horizontal consolidation should still be treated as a correction. The recommended operation is to enter long positions in the 62200-62500 range during the pullback, with a target of 64000-64500. Pay attention to breaking through 65000-67000 to the previous high, and defend against downside at 61200!

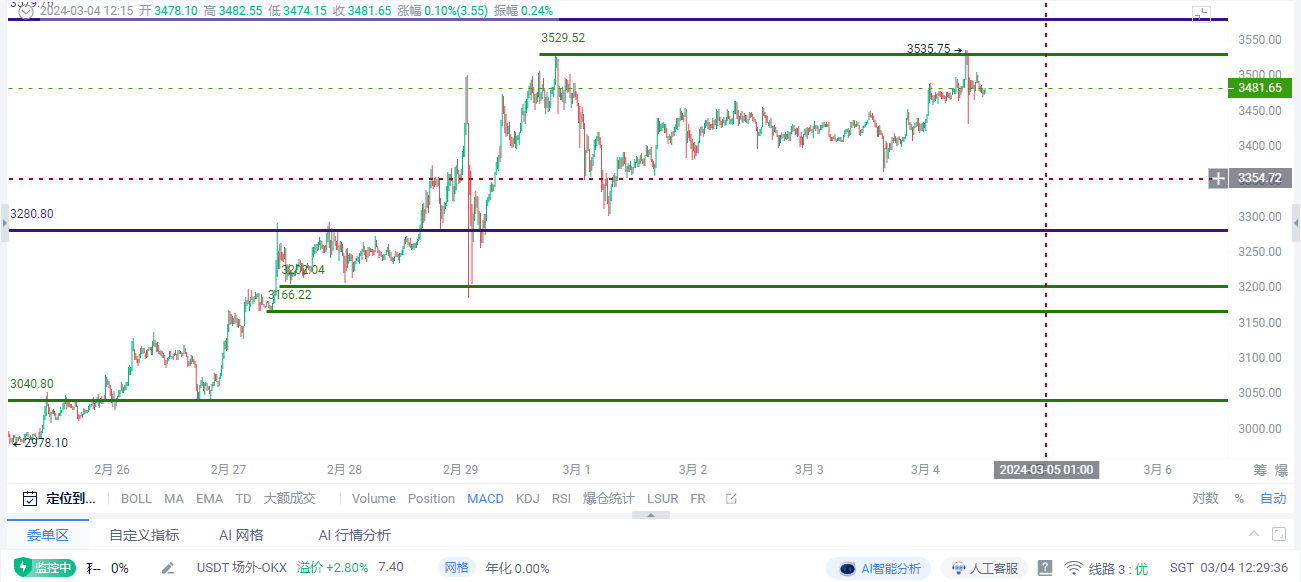
Ethereum also saw a strong one-sided upward movement after a few days of oscillation, reaching the 3535 level and then breaking a new high, followed by a large wick down to 3430 on the 15-minute chart, then rising again to around 3480 for oscillation. The recent wicks have been quite frequent. Looking at the 4-hour structure, after the Bollinger Bands contracted, there is a temporary trend of opening up again. Currently, the 4-hour chart is in a state of bearish divergence. To resolve the divergence, it either needs to retrace and oscillate, or the MACD needs to form a golden cross to push to a new high. The one-hour chart has been moving along the upper band, and the 15-minute chart has been oscillating upwards along the middle band and upper band. There are now slight signs of weakening on the 15-minute chart. After the current Bollinger contraction is completed, pay attention to its strength and weakness in the oscillation range, and continue to maintain a bullish mindset for layout. The recommended operation is to enter long positions in the 3420-3380 range during the pullback, with a target of 3520-3550. Pay attention to breaking through 3580-3650, and the downside support is at 3350!
In this market, ultimately it comes down to ability. If your ability is insufficient, what the market gives you will eventually be taken back. Therefore, when your wealth exceeds your ability, you need to control the retracement, although this control is futile because that kind of profitable arrogance and arrogance will ultimately destroy a person's rationality. However, in the capital market, we don't have to worry about the situation where our wealth is lower than our ability, because this kind of imbalance will eventually be corrected by time. If it is not corrected, there is only one reason, which is that your ability is insufficient. If you are still in a state of confusion, not understanding the technology, not knowing how to read the market, not knowing when to enter the market, not knowing when to stop loss, not knowing when to take profit, randomly adding positions, getting trapped at the bottom, unable to hold onto profits, and unable to handle market volatility, these are all common problems among retail investors. However, it's okay. You can come to me, and I will guide you in the right direction for trading. A thousand words are not as good as one profitable trade. It's better to be precise than to trade frequently, making every trade valuable. What you need to do is find me, and what we need to do is prove that what we say is not empty. 24-hour real-time guidance for trading. The market fluctuates quickly. Due to the impact of timeliness during review, for the subsequent market trends, real-time layout is the main focus. Coin friends who need contract guidance can scan the QR code at the bottom of the article to add my public account.

免责声明:本文章仅代表作者个人观点,不代表本平台的立场和观点。本文章仅供信息分享,不构成对任何人的任何投资建议。用户与作者之间的任何争议,与本平台无关。如网页中刊载的文章或图片涉及侵权,请提供相关的权利证明和身份证明发送邮件到support@aicoin.com,本平台相关工作人员将会进行核查。


