【BTC Market Analysis】
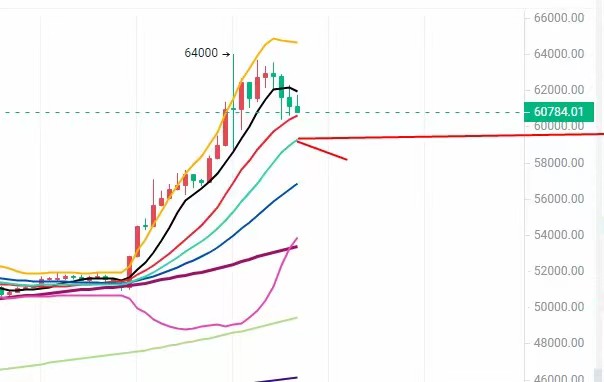
The four-hour chart of Bitcoin formed a doji candlestick pattern on the 28th, and yesterday it reached 63800 without breaking through, resulting in a small pullback. The moving averages are still in a bullish arrangement, so the market is likely to continue fluctuating in the near term. It would be better to enter the market for long positions on dips today, but pay attention to the turning points in the U.S. session.
The one-hour KDJ indicator is flattening out below and is about to enter the oversold zone.
The one-hour support candles formed two double bottom doji signals at 59700 and 59230 on the 29th.
The middle Bollinger Band on the four-hour chart is around 59300.
Therefore, pay attention to the support levels today: 60200, 59700, and 59300.

免责声明:本文章仅代表作者个人观点,不代表本平台的立场和观点。本文章仅供信息分享,不构成对任何人的任何投资建议。用户与作者之间的任何争议,与本平台无关。如网页中刊载的文章或图片涉及侵权,请提供相关的权利证明和身份证明发送邮件到support@aicoin.com,本平台相关工作人员将会进行核查。


