
Since its listing on January 11, 11 spot Bitcoin ETFs have seen a net inflow of about $5.5 billion. The total holdings of Bitcoin ETFs are 732,000 bitcoins, and the management fund size has increased from $28.59 billion to $40.896 billion, with a cumulative increase of $8.6 billion. Grayscale reduced its holdings by 175,000, from 617,000 to 445,000, while BlackRock acquired 127,000. 
Bitcoin ETFs have attracted a large amount of capital inflow, while gold funds have shown capital outflow. Although some analysts believe that this trend of outflow is unlikely to last, industry observers point out that the assets of Bitcoin funds may one day exceed the $90 billion gold ETF market, with the current market value of Bitcoin at around $44.8 billion. It took several years for gold ETFs to attract a flow level similar to that of spot Bitcoin ETFs. So I think surpassing the scale of gold is only a matter of time. But the trend of continuous inflow is unlikely to last long. If there is a significant retracement, everyone still needs to pay attention to the market.
Bitcoin
Bitcoin broke through 60,000 in a short squeeze, returning to 60,000 after 829 days, with a nearly 60% increase in the spring festival market in about a month. Congratulations to friends who followed. We seized the red envelope market from 2020 to 2024. Bitcoin broke through the Fibonacci 0.786 (57,600), with only 12% room to reach 69,000. Our strategy remains unchanged. Although there may still be an increase in the short term, we only play short-term in this area to lock in profits. Remind to reduce positions on rallies and pay attention to risks, and be cautious when it comes to 60,000.
Next, pay attention to two situations: one is a rapid retracement, in which case profits should be locked in in a timely manner, and the other is high-level oscillation in this area, similar to the oscillation around 64,800 in 2020. There are opportunities for Ethereum and altcoins to make up for the rise.
As for breaking through 69,000, I personally think there is a certain probability, but I won't easily attempt it at this level. It's better to wait for a valid breakthrough at 69,000, which will completely change the overall situation.

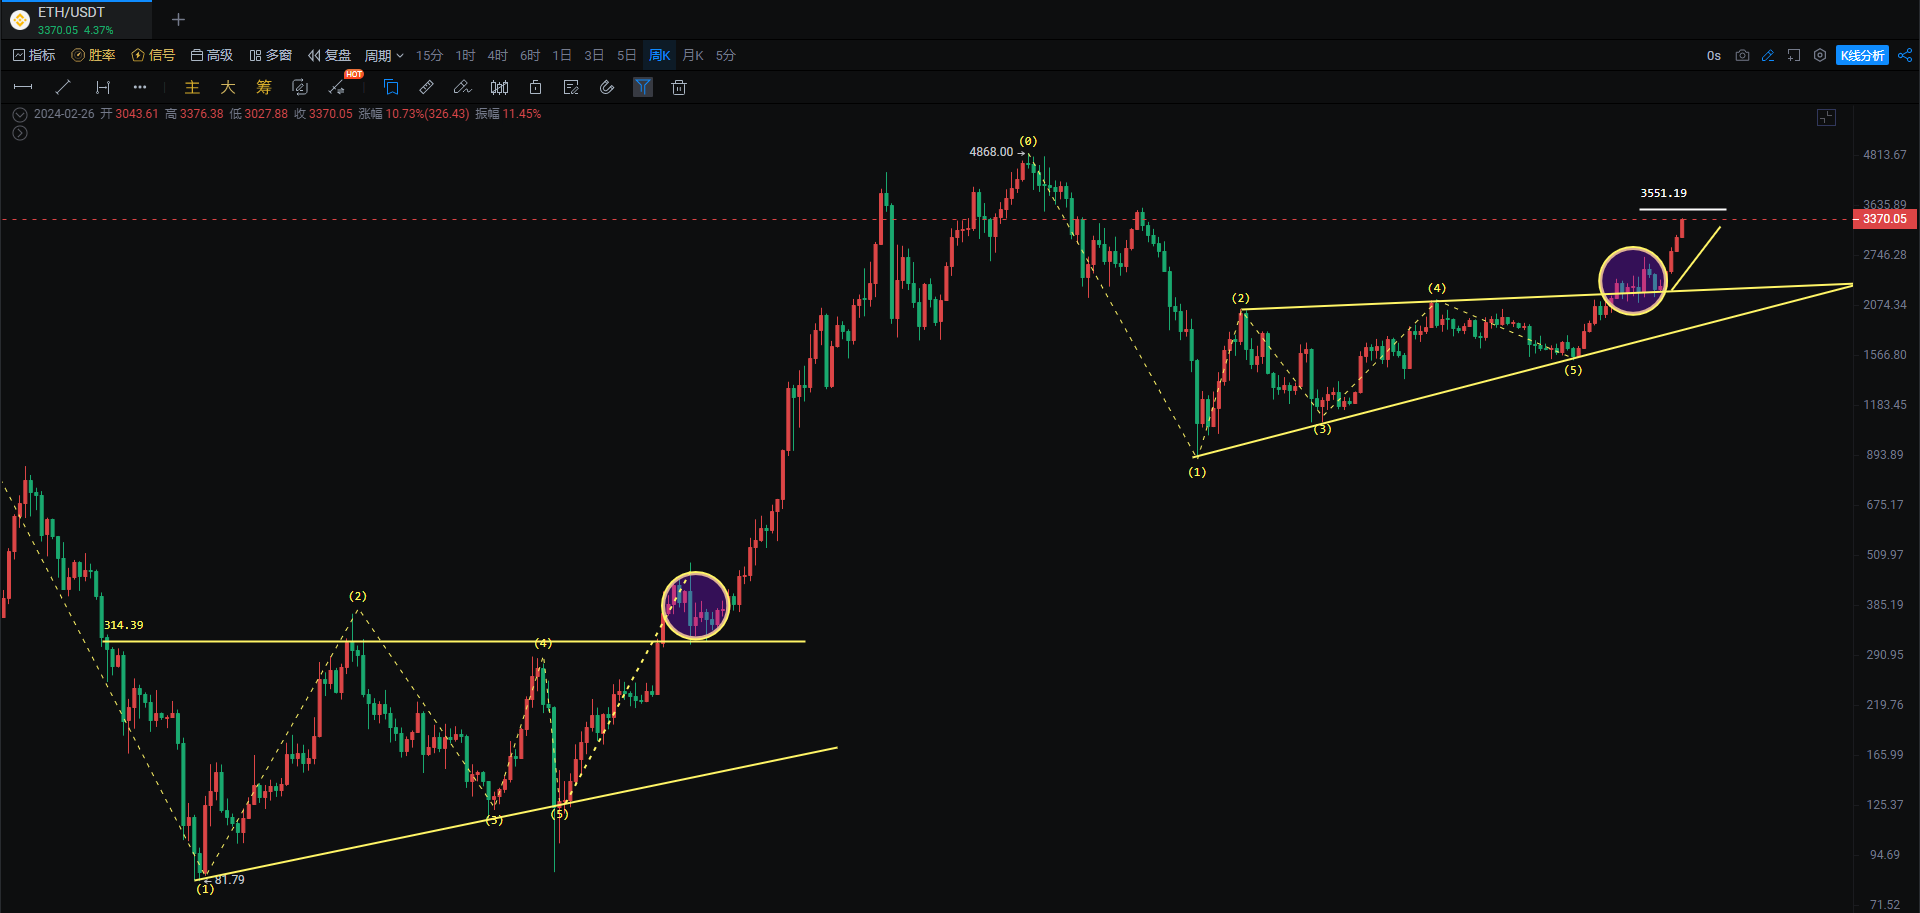
Ethereum
Breaking through the highest point of 3,300 to reach 3,376, piercing through the Fibonacci 0.618 (3,350), the next pressure is at 3,550. Whether it's Bitcoin or Ethereum, there is still no obvious retracement or turning point in the short term, with shrinking trading volume. However, such a rapid rise is not normal. We reminded of opportunities around 20,000 to 25,000, and advised to do short-term trading above 44,000. Wait for a value dip to make medium to long-term layouts.
ETH/BTC has fallen for two consecutive days, retracing to 0.55. The entire weekly chart has been bottoming here for over 140 days and is still oscillating. Pay attention to whether there will be a rebound in the 0.51-0.53 range.

If you like my views, please like, comment, and share. Let's go through the bull and bear markets together!!!
The article is time-sensitive and is for reference only, with real-time updates.
Focus on candlestick technical research, win-win global investment opportunities. WeChat public account: 交易公子扶苏
免责声明:本文章仅代表作者个人观点,不代表本平台的立场和观点。本文章仅供信息分享,不构成对任何人的任何投资建议。用户与作者之间的任何争议,与本平台无关。如网页中刊载的文章或图片涉及侵权,请提供相关的权利证明和身份证明发送邮件到support@aicoin.com,本平台相关工作人员将会进行核查。


