Establishing a Position, Managing Holdings, Selecting Positions - The Three Steps to Success!
In the last few trading days of February, both Bitcoin and Ethereum have been continuously hitting new highs. Bitcoin started at 42,000 at the beginning of the month and has now reached a high of 57,600, with nearly 16,000 points of space and a 37% increase. Ethereum started at 2,240 and is currently hovering around the 3,300 mark, with a space of 1,100 points and a 46% increase.
The continuous upward trend is still a one-way trend. Although the bullish trend does not indicate a peak and the bearish trend does not indicate a bottom, there is no continuous one-way movement. After a one-way movement, there will be a correction. After a substantial upward movement, if there is no rapid retracement, it means a time correction method. The correction phase generally involves a small retracement at a high level. The market in the past few days has been exactly like this. The slight retracement after the early morning surge indicates a time correction. The next move will not be a rapid breakthrough. The market is currently in a high-level oscillation.
Compared to Bitcoin, Ethereum seems slightly sluggish, with the degree of high point refresh not as exaggerated. The daily chart is temporarily showing five consecutive positive candles, and the moving averages are in a downward posture. The 4-hour chart is following the five-day moving average and the ten-day moving average in an upward trend. Although there have been retracements, it has not successfully broken through the support of the ten-day moving average. The red MACD histogram is gradually shrinking, and the five-day moving average and other technical indicators are also showing a downward trend. For now, let's see if the five-day moving average can converge with the ten-day moving average to form a death cross. If the death cross forms and can break through the support near 3,210, then there is a chance for further retracement in the market.
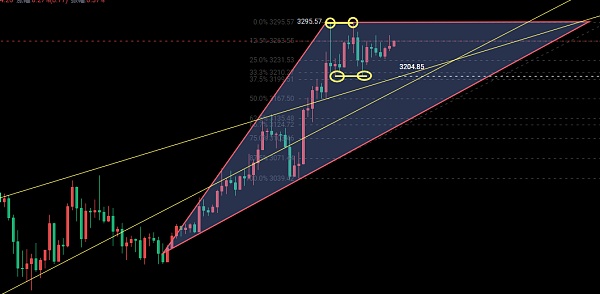
The one-hour chart shows an ascending triangle pattern, with double pin tops at the top of the triangle, briefly topping near 3,295, and two retracements after the double tops, forming a double pin bottom at the 3,205 level. The upward trend line and the downward trend line converge to form a strong turning point at 3,205, which can be said to determine the subsequent trend. It is located at the 0.35 Fibonacci retracement level. If it is breached, the retracement space will further expand; if held, the horn for continued advancement will be sounded.
Overall, Ethereum is in a consolidation phase near the high point, oscillating around the 3,295-3,205 range. We will use this as a reference for short-term trading. For large space trades, due to the current price not being ideal and the lack of clear top signals and new turning points after the pullback, we will temporarily not participate and will make a decision based on the evening market conditions.
In summary: Daytime narrow range consolidation, with a focus on long positions for evening retracements. Enter long positions for Ethereum retracements at 3,215-3,195, with a stop loss at 3,175, and take profit first at 3,275-3,285. If the market undergoes a sudden change, we will make adjustments on the spot.
Due to the impact of the review time, for subsequent on-the-spot adjustments, real-time offline strategies will be the main focus. This article is recommended for reference only. Follow my trades and make money, you can do it too! Rain or shine, I'll be waiting for you at Wolong.
WeChat Official Account: Zhuge Talks Coin

免责声明:本文章仅代表作者个人观点,不代表本平台的立场和观点。本文章仅供信息分享,不构成对任何人的任何投资建议。用户与作者之间的任何争议,与本平台无关。如网页中刊载的文章或图片涉及侵权,请提供相关的权利证明和身份证明发送邮件到support@aicoin.com,本平台相关工作人员将会进行核查。


