
The halving of Bitcoin is 54 days away on 04/21. CoinShares recently released its annual Bitcoin mining report, predicting that after the halving of Bitcoin production in May 2024, the average production cost of each Bitcoin will rise to $37,000. This is mainly due to the significant increase in network computing power, which increases the mining difficulty and thus the cost of mining Bitcoin. Therefore, our view is that the pullback is an opportunity, waiting for the opportunity to lay out long-term positions.
As for whether a situation similar to the 312 event will occur, the 312 event was caused by the uncertainty of the epidemic, a wave of corporate bankruptcies, and increased economic burdens, leading to panic in macroeconomic sentiment, which quickly spread to major financial markets. The transmission path is generally USD - US stocks - gold - BTC.
The US stock market has experienced four circuit breakers. Currently, the Dow Jones and S&P 500 are at historic highs, and the Nasdaq index has risen to near its previous high. The US dollar index is oscillating within a weekly range. Assuming a one-way trend from 2021 to 2022 is considered as wave 1, and the oscillation is considered as wave 2, there is a potential downward wave 3 that needs to wait for a break below 99.57 to be officially confirmed. Therefore, from the perspective of fund flows in the US stock market, it is relatively safe at the moment. There will definitely be a major pullback, but the probability of a situation similar to 312 is low.
In addition, with the SEC's approval of the Bitcoin ETF, mainstream financial institutions will increase their investment asset allocations. Institutional issuers continue to expand their Bitcoin holdings, reducing liquidity. Buying ETFs is equivalent to indirectly buying BTC. You own a Bitcoin fund that can be tracked. However, as of the 21st, there has been a net outflow of $3,570 from the spot ETF, and the IShares Bitcoin Trust IBIT has risen for 17 consecutive trading days to a high of 30.23 before falling back, with pressure near the upper shadow at the opening. We are closely monitoring this situation.
Bitcoin
On the weekly chart, a doji star indicates temporary strength. The daily chart has been oscillating for 11 days, forming a platform, which often indicates a continuation of the uptrend. If it does not fall below 49,932-50,500, the short-term outlook continues to be oscillating upwards. Only if it fails to recover after falling below 49,932 will we consider a decline. After multiple touches of the bottom of the box on the 4-hour chart, there has been a rebound, and a smaller-scale box oscillation has occurred temporarily.
Support:
Resistance: 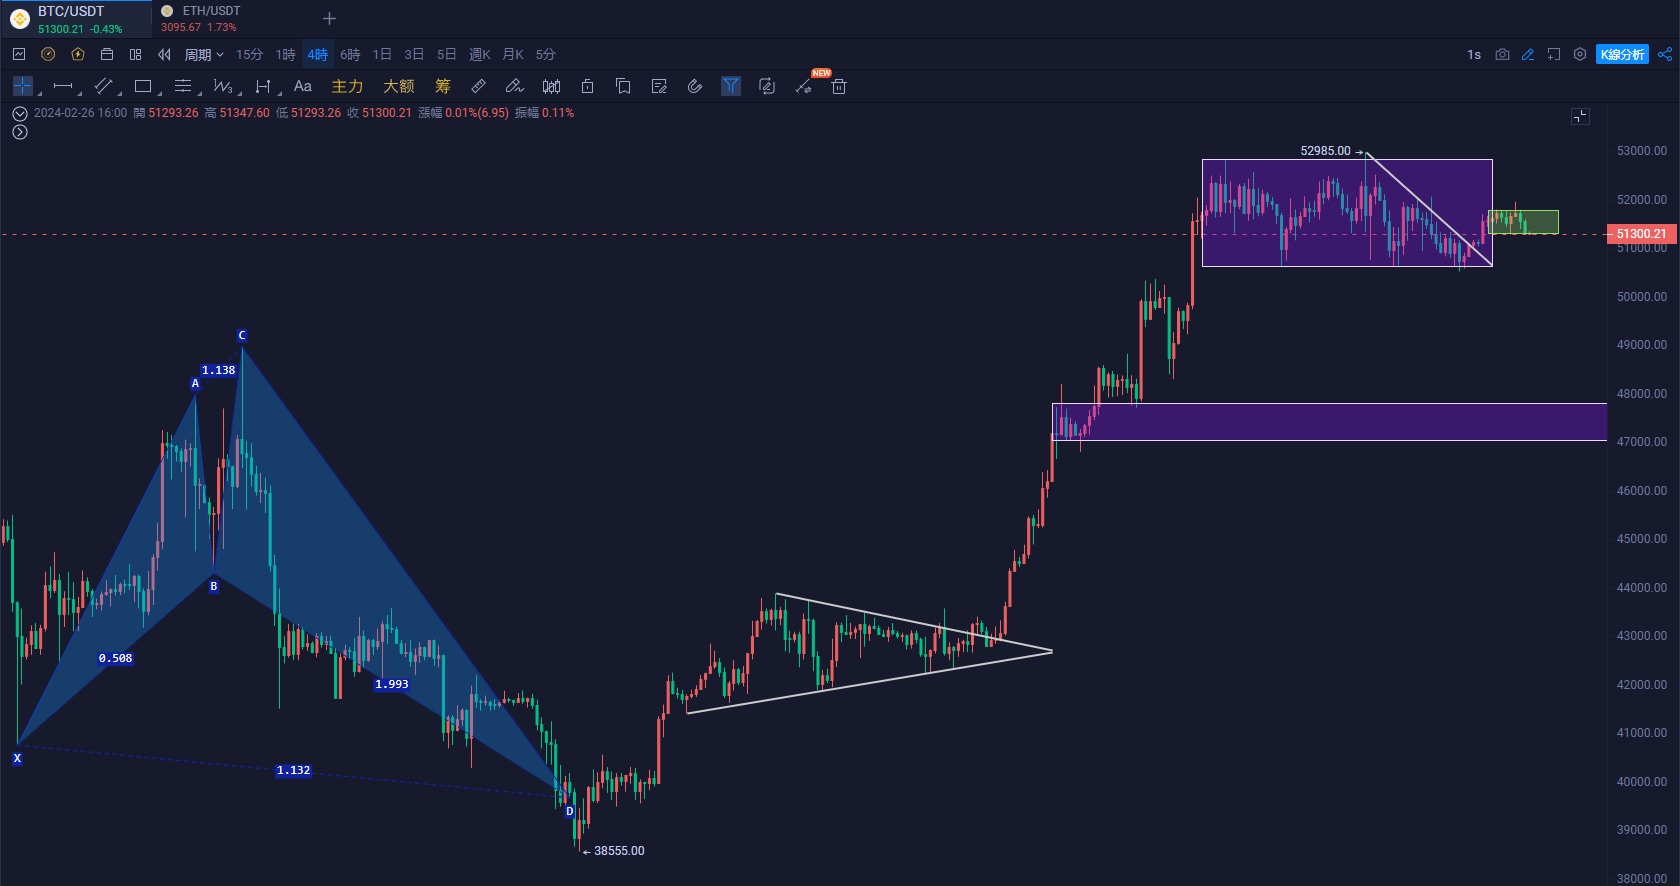
Ethereum
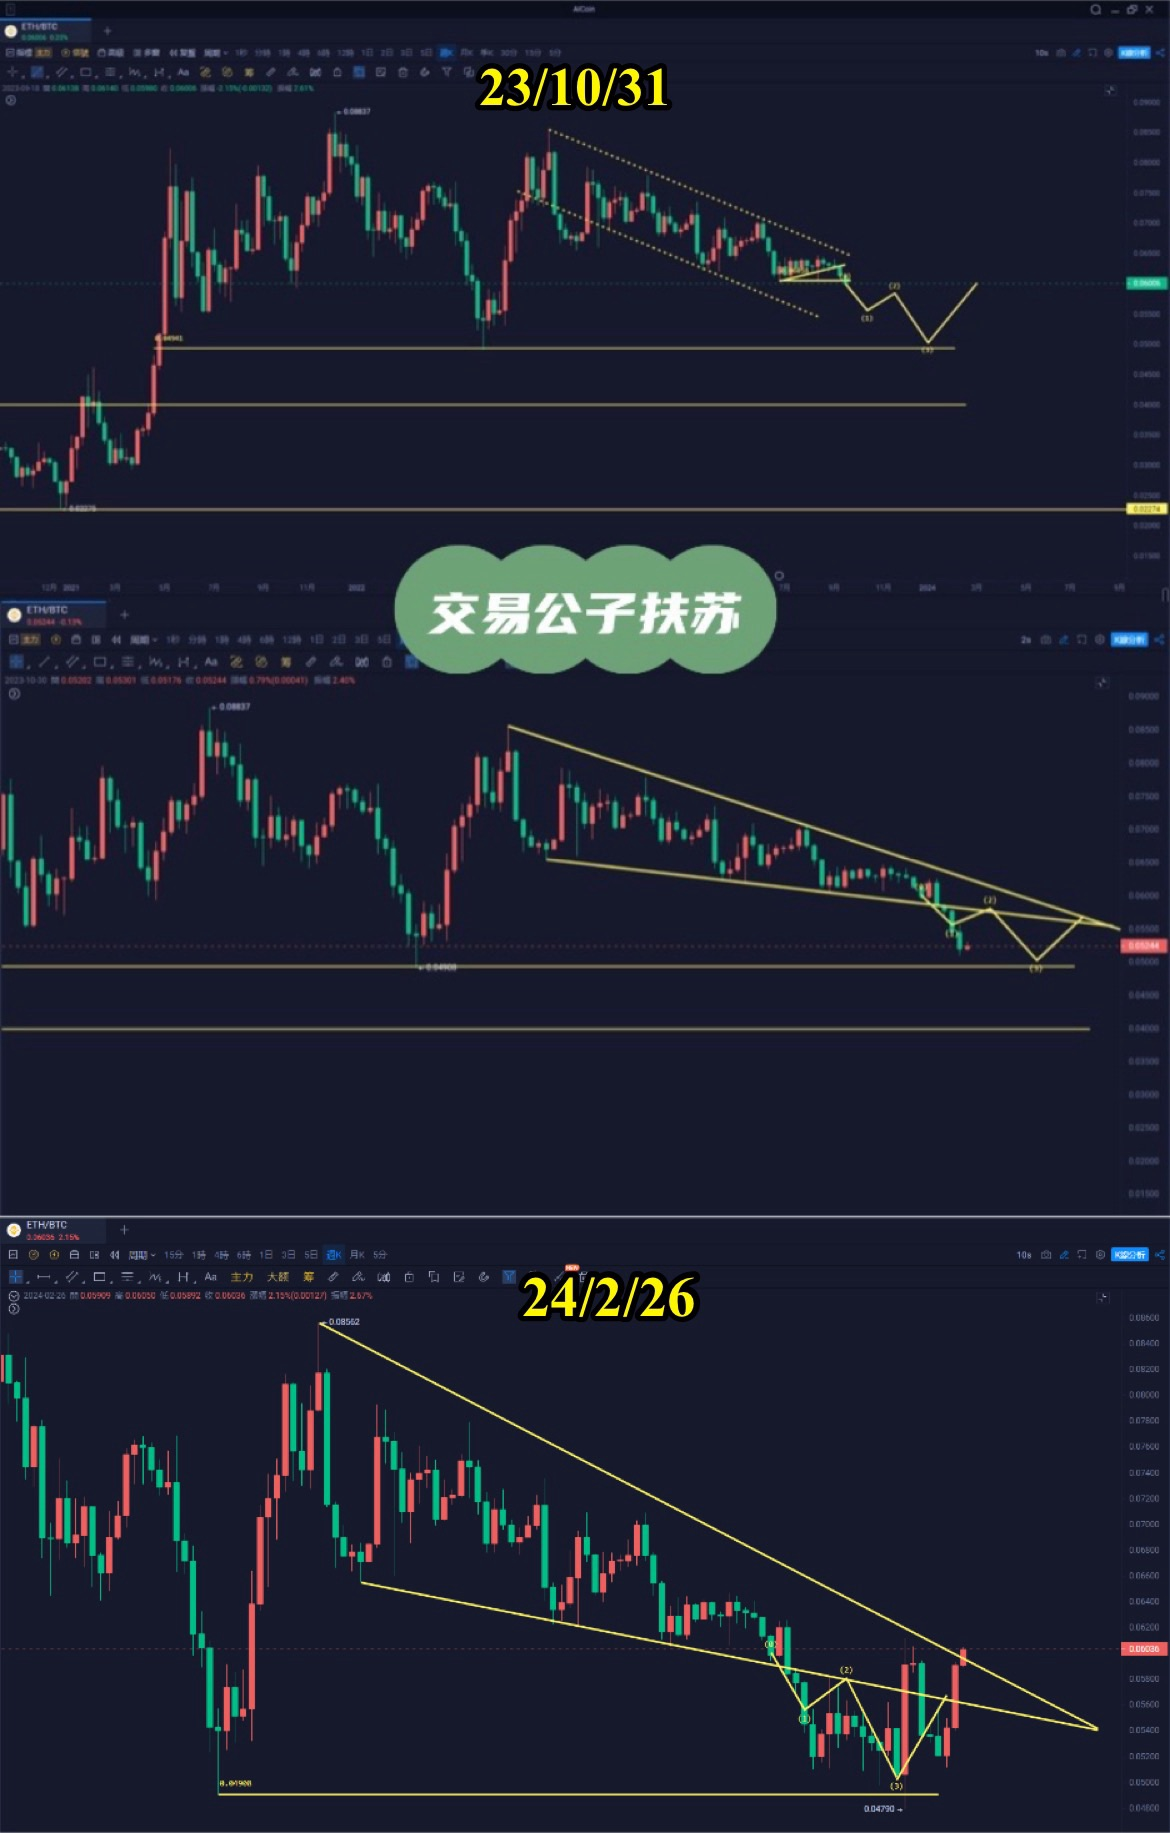
Ethereum continues to hit new highs, reaching 3,135. We mentioned that after breaking through 3,000, the next target is 3,300, which is the Fibonacci 0.618 level. On the 4-hour chart, it has formed an ascending triangle breakout, indicating short-term strength. The ETH/BTC exchange rate has rebounded to 0.06, reaching the high point of January 13. Currently, after breaking through the downtrend channel, there is a chance of further rebound without breaking the process.
Support:
Resistance: 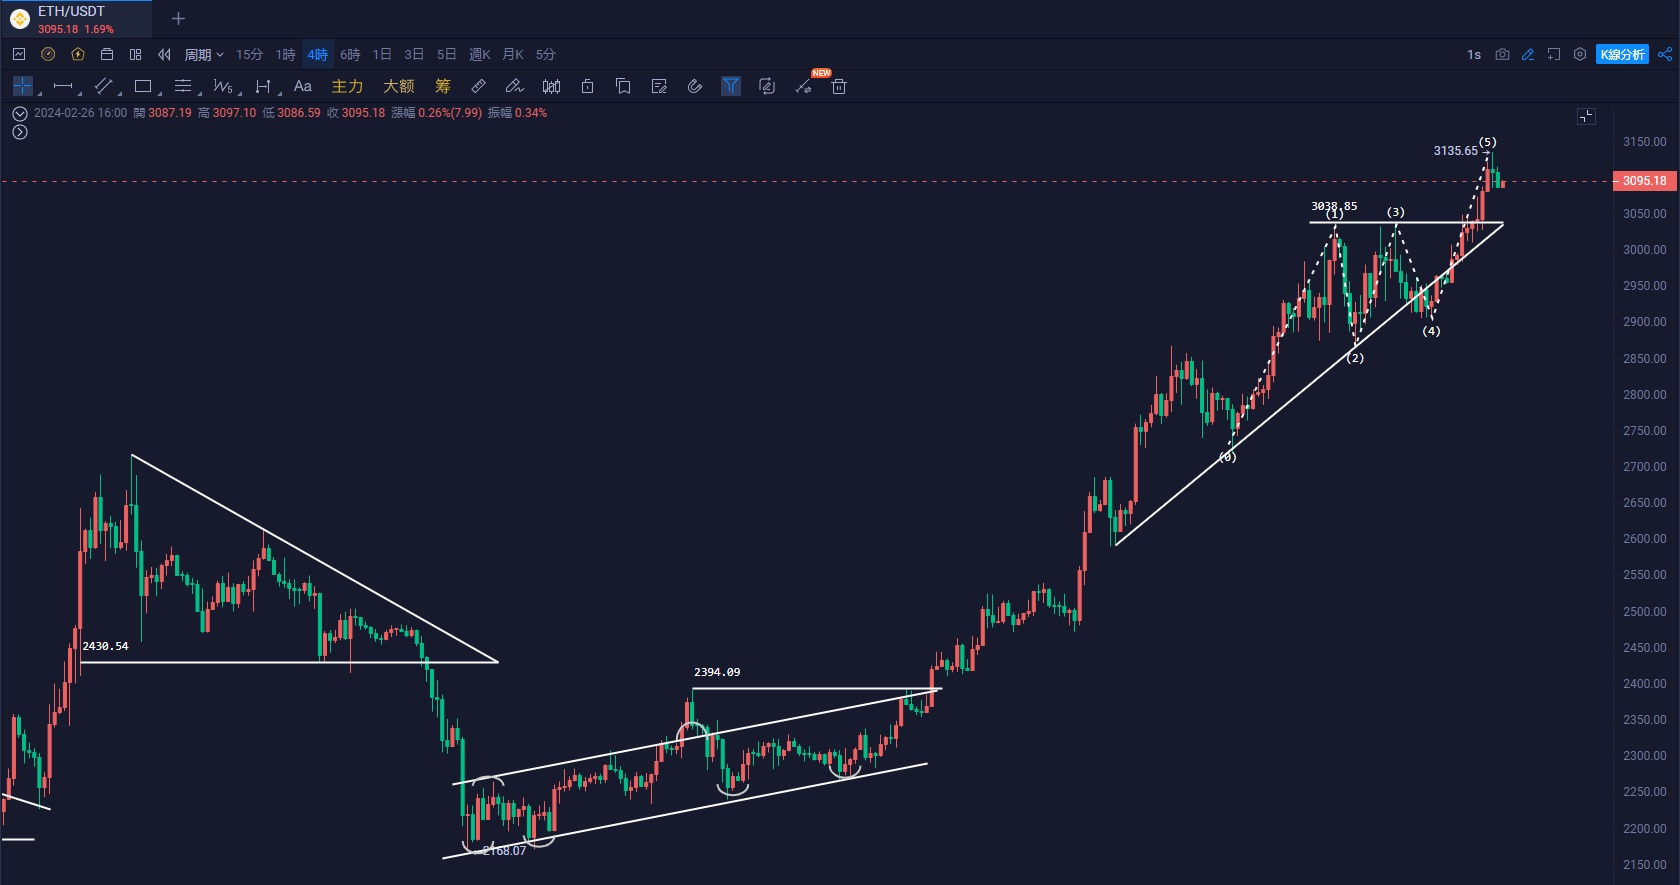
Sector
AI sector: WLD, AGIX, RNDR, FET, CTXC, NFP, LAT
Kankan upgrade: OP, ARB, MATIC, LRC, SNX
DEFI: UNI, SUSHI, DYDX, 1INCH
…
If you like my views, please like, comment, and share. Let's navigate the bull and bear markets together!!!
The article is time-sensitive and is for reference only, with real-time updates.
Focus on candlestick technical research, win-win global investment opportunities. WeChat public account: Trading Master Fusu
免责声明:本文章仅代表作者个人观点,不代表本平台的立场和观点。本文章仅供信息分享,不构成对任何人的任何投资建议。用户与作者之间的任何争议,与本平台无关。如网页中刊载的文章或图片涉及侵权,请提供相关的权利证明和身份证明发送邮件到support@aicoin.com,本平台相关工作人员将会进行核查。


