Tracking real-time hotspots in the currency circle, seizing the best trading opportunities. Today is Monday, February 26, 2024, and I am Yibo! We do not predict trades, but actually observe market fluctuations (narrowing, spreading), structure (market batch structure), and sentiment (external market such as US stocks, USD, etc.). As a trader, you (through trading) not only influence prices but are also influenced by prices as a factor affecting your emotions and behavior.

This week, there are no major fundamentals, so without major fundamental influences, we look at the trend structure. From the market perspective, after a sharp rise in the long position, the market has entered into a shakeout, with both long and short positions tightly held. This is a typical time correction. Yesterday, there was a shakeout and consolidation during the day, and it remained strong in the evening. Both Bitcoin and Ethereum broke through their respective positions, with Bitcoin testing the 52,000 level again, and Ethereum continuously breaking through to new highs, reaching a peak of 3130. The targets for long positions from yesterday's pullback were basically achieved. Congratulations to friends who followed the layout and profited again.
Bitcoin has been in a shakeout market for the past 10 days. Neither the long nor short positions have brought much surprise. Looking at the current Bitcoin daily chart, the price is once again running above the daily trend line of 51,000. The daily chart shows an upward golden cross. BOLL continues to run smoothly. Therefore, the daily chart still indicates a shakeout bias. Looking at the weekly chart, BOLL is starting to converge, indicating a short-term shakeout in the Bitcoin market. However, the weekly trend is bullish. Looking at the monthly chart, there is an upward golden cross. The low point before the year-end is close to the monthly trend line, forming a rapid rebound. Taking these three points into consideration, the overall trend of Bitcoin is still bullish for the time being, but the short-term market is dominated by shakeouts and rebounds. Therefore, the recent operation is mainly focused on long positions on pullbacks and watching for a rebound above 50,000. The short-term 4-hour chart currently maintains a weak bullish trend. In the early session, the price of Bitcoin retraced to near the daily trend line of 51,200 and found support. The 4-hour MACD shows an upward golden cross. Therefore, today's short-term operation is also mainly focused on long positions on pullbacks.

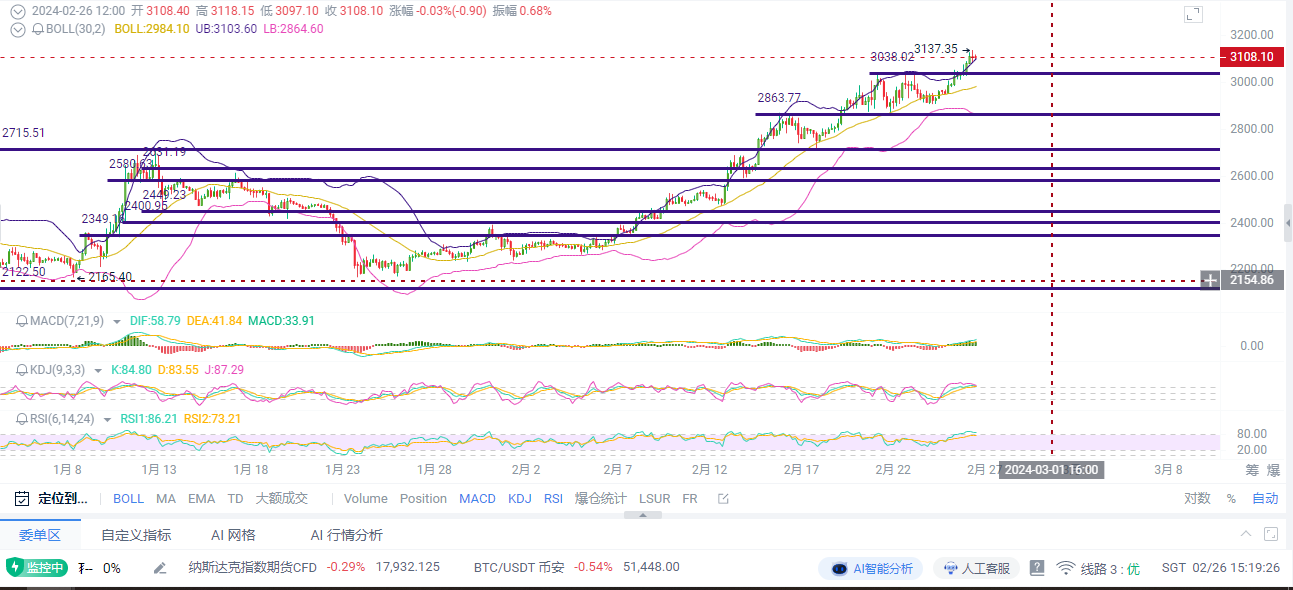
Ethereum's long position remains strong as usual, continuously rising to the 3137 level, and then entering a narrow range shakeout. It also successfully stabilized above the pressure level of 3076. Breaking through this pressure level, the price is highly likely to reach around 3227-3306. Looking at the daily technical indicators, both the KDJ and MACD technical indicators are in a bullish resonance phase. Today is Monday, and Ethereum has been in a continuous uptrend for four weeks, with three of those weeks being large upswings, accompanied by a significant increase in trading volume. The bullish momentum is strong, showing a similar trend to the rebound to 4870 in the past. However, the technical indicators show a slight downward trend, and the daily chart shows a decreasing pullback intensity as the market continues to rise. It is worth noting that despite the price increase, the MACD green volume bars are shrinking. At this time, it is necessary to pay attention to whether there is a divergence phenomenon. Looking at the 4-hour technical indicators, both the KDJ and MACD technical indicators are slowly increasing in the bullish direction, and the MA5 and MA10 moving averages are crossing upwards. In the short term, the BOLL technical indicator shows that the price is closely attached to the upper band, and the DIF and DEA technical indicators are jointly pressing upwards. At the same time, the MA7 moving average shows a bullish pattern. From a short-term perspective, the bullish volume has not yet ended, and the midday and evening operation strategies are recommended to focus on low long positions.
In this market, ultimately it comes down to ability. If your ability is insufficient, what the market gives you will eventually be taken back. Therefore, when your wealth exceeds your ability, you need to control the pullback, even though this control is futile, because that kind of profitable arrogance and arrogance will ultimately destroy a person's rationality. However, in the capital market, we do not need to worry about the situation where our wealth is lower than our ability, because this kind of imbalance will eventually be corrected by time. If it is not corrected, there is only one reason, which is that your ability is insufficient. If you are still in a state of confusion, not understanding the technology, not knowing how to read the market, not knowing when to enter, not knowing how to stop loss, not knowing when to take profit, randomly adding positions, getting trapped in bottom fishing, unable to hold onto profits during market volatility, these are all common problems among retail investors. However, it's okay. You can come to me, and I will guide you in the right direction for trading. A thousand words are not as good as one profitable trade. Instead of frequent operations, it's better to be precise, making every trade valuable. What you need to do is find me, and what we need to do is prove that what we say is not empty. 24-hour real-time guidance for trading. Market volatility is fast, and due to the impact of timeliness during review, for the subsequent market trends, real-time layout based on actual trading is the main focus. Coin friends who need contract guidance can scan the QR code at the bottom of the article to add my public account.

免责声明:本文章仅代表作者个人观点,不代表本平台的立场和观点。本文章仅供信息分享,不构成对任何人的任何投资建议。用户与作者之间的任何争议,与本平台无关。如网页中刊载的文章或图片涉及侵权,请提供相关的权利证明和身份证明发送邮件到support@aicoin.com,本平台相关工作人员将会进行核查。


