Click to watch the video: Master Chen's 2.23 Video: New Indicator for New Buying Points, Short-term Analysis of the Market
Today in the video, we will share some clues for going long on Bitcoin by 100 times. Last year, I predicted that it was possible for 25,000 to be the bottom for 2023, allowing everyone to continue going long on Bitcoin. The profits from holding have been consistent. Or today, let's discuss the new indicator I shared yesterday, which shows a very high success rate for long positions, including Bitcoin's recent short-term trends.

First, let's take a look at the two-month chart of Bitcoin. I shared the logarithmic MACD indicator with you yesterday, and some friends also messaged me asking about the difference between this indicator and the regular MACD indicator. I feel that the logarithmic MACD indicator responds faster.
Including yesterday, I mentioned that we should observe the current two-month MACD indicator, which is in a golden cross position. The last time it was in this position was in September 2020, and Bitcoin surged like crazy afterwards.
Or it was in January 2017 at this position, the logarithmic MACD indicator was in a golden cross position, and there was a crazy surge afterwards. So, I hope everyone will continue to hold onto the profits from long positions. The top has not arrived yet. What is the difference between the logarithmic MACD indicator and the regular MACD indicator?
I have observed that it responds faster. For example, when it crosses down from the top, its response is very fast, while the regular MACD indicator only starts to show a death cross when it falls to this position.
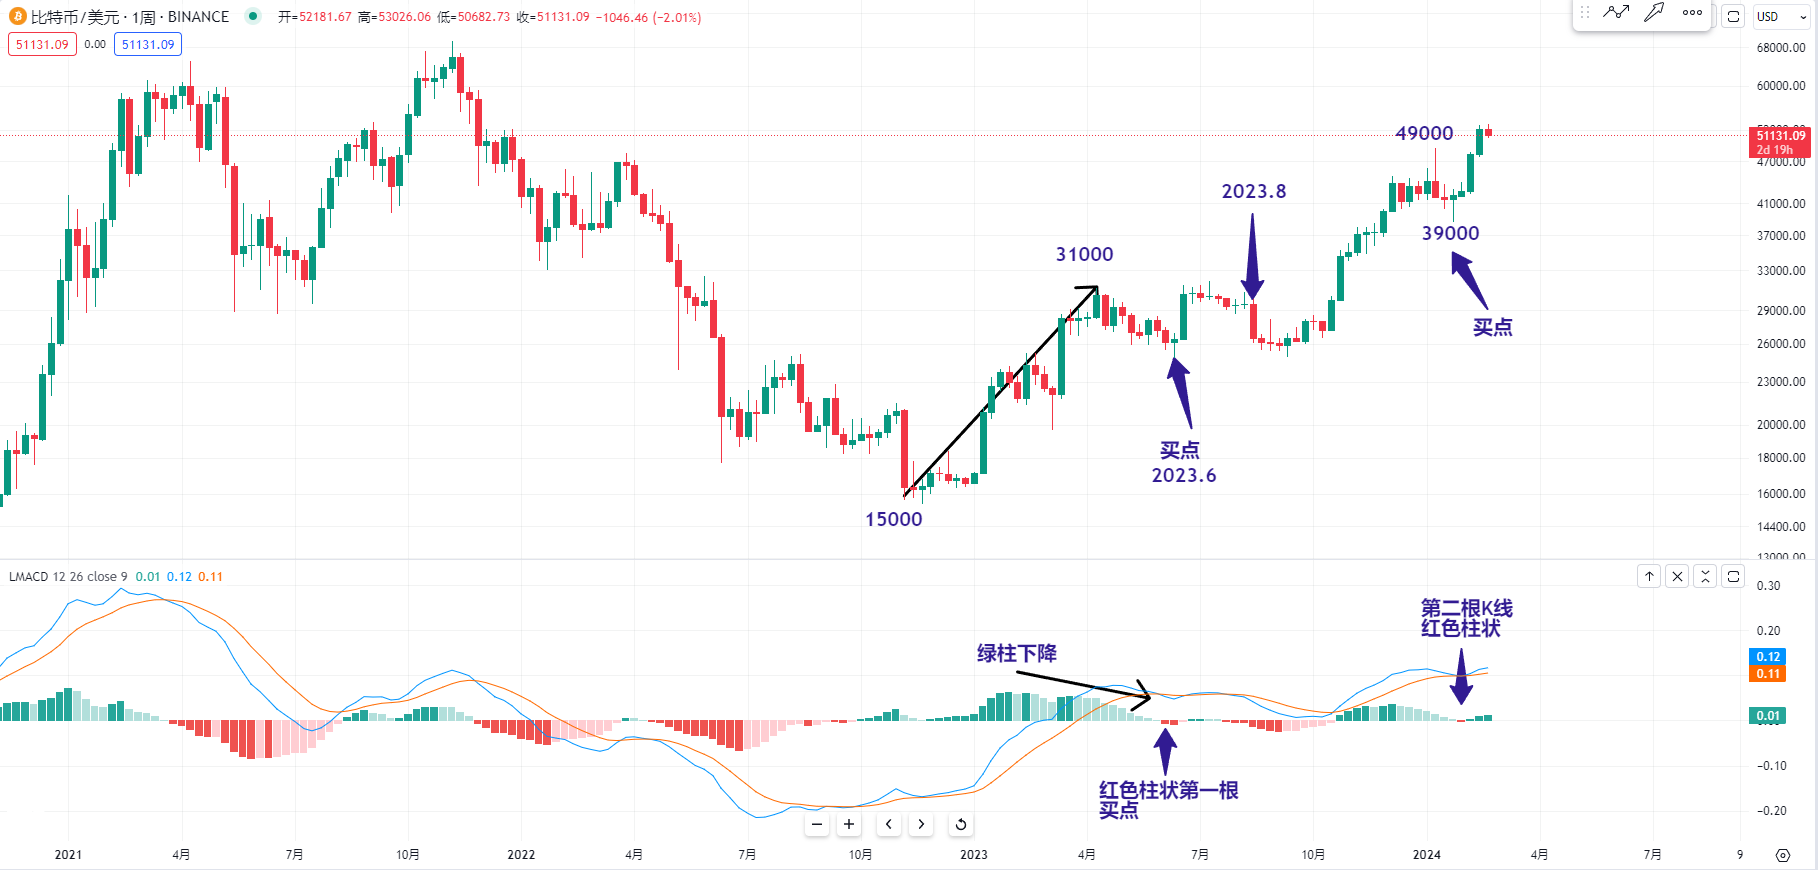
Or let's take a look at the weekly chart of Bitcoin. Because I found that the buying point position of the logarithmic MACD indicator responds faster than the regular MACD indicator, we can observe Bitcoin in June 2023.
It is obvious that from the low of around 15,000 to the high of about 31,000, we can clearly see the green bars of the logarithmic MACD indicator starting to decline below, or we can observe the first red MACD bar coming out. The candlestick below the rising buy point is a low point.
After that, Bitcoin had a surge, so I found that the logarithmic MACD indicator seems to respond very quickly. The first red bar is a buying point, or in August 2023, the red bar below is not the first one.
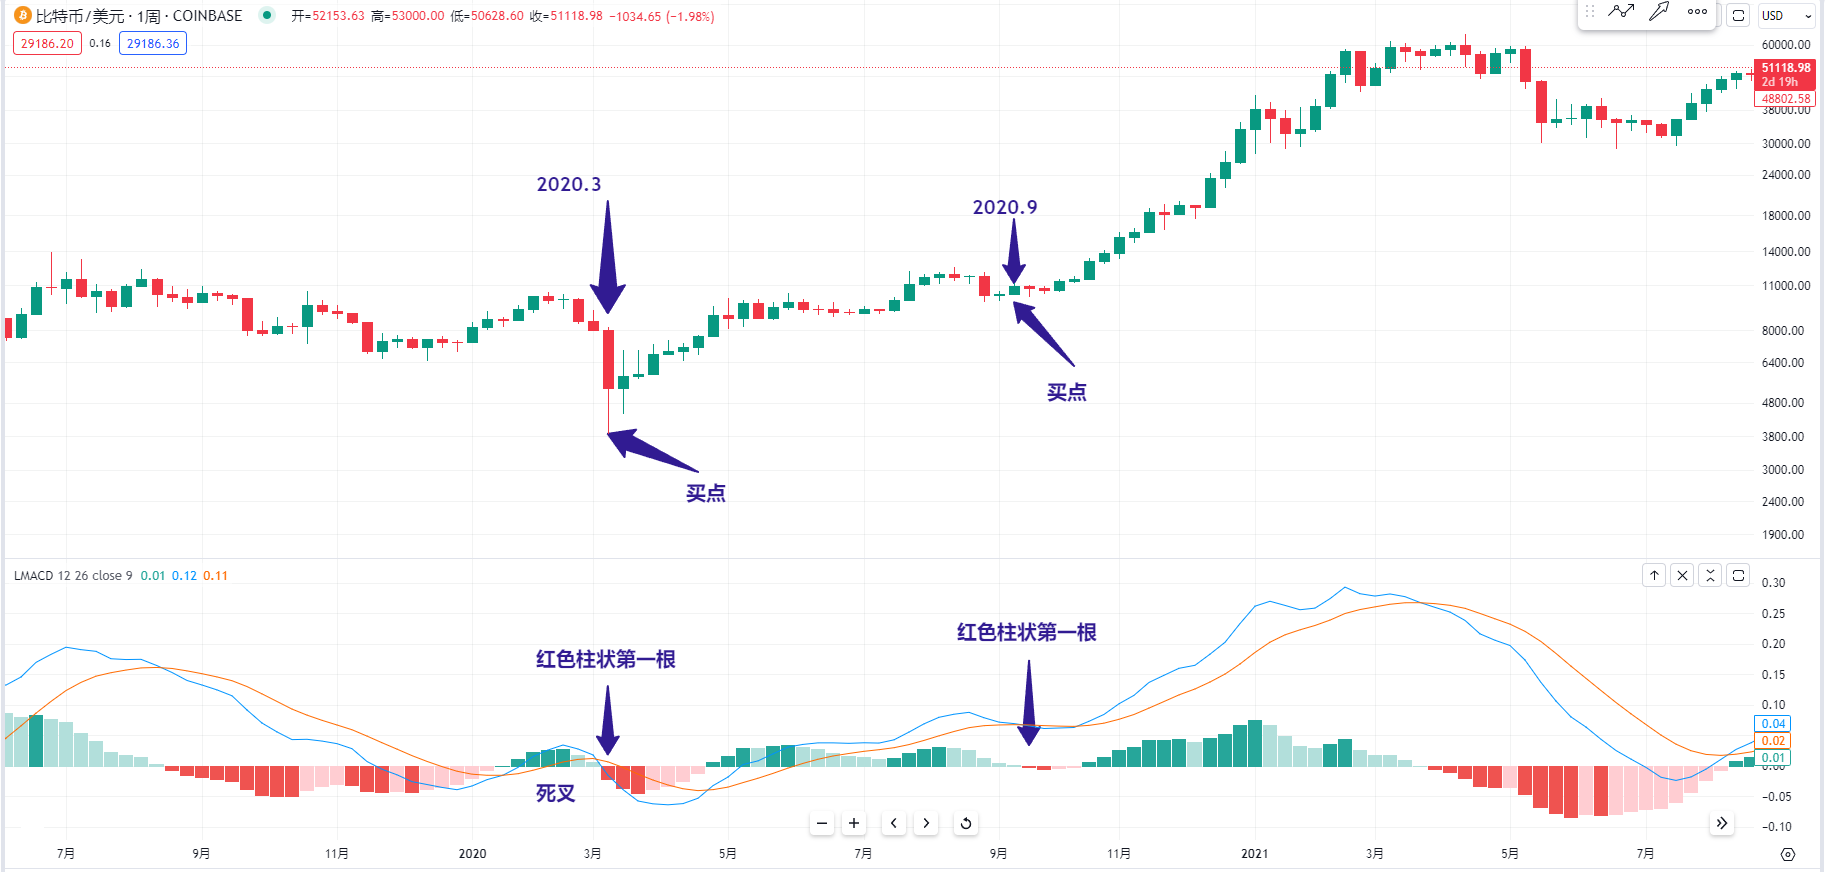
However, we can observe the bull market of Bitcoin from 2019 to 2021. It is obvious that at this position in September 2020, this low point did not break the low point of the previous big drop candlestick.
And we can also observe the logarithmic MACD indicator below, the first red bar of the death cross, this low point is a very important buying point, and the price did not fall afterwards. So, positions like this are very good for going long.
Or we can observe the low point of the pandemic crash in March 2020. We can see the logarithmic MACD indicator below also had a death cross, and the first red bar came out. You can participate in a 100x long position at this point with a small position. So, this logarithmic MACD indicator is quite accurate.
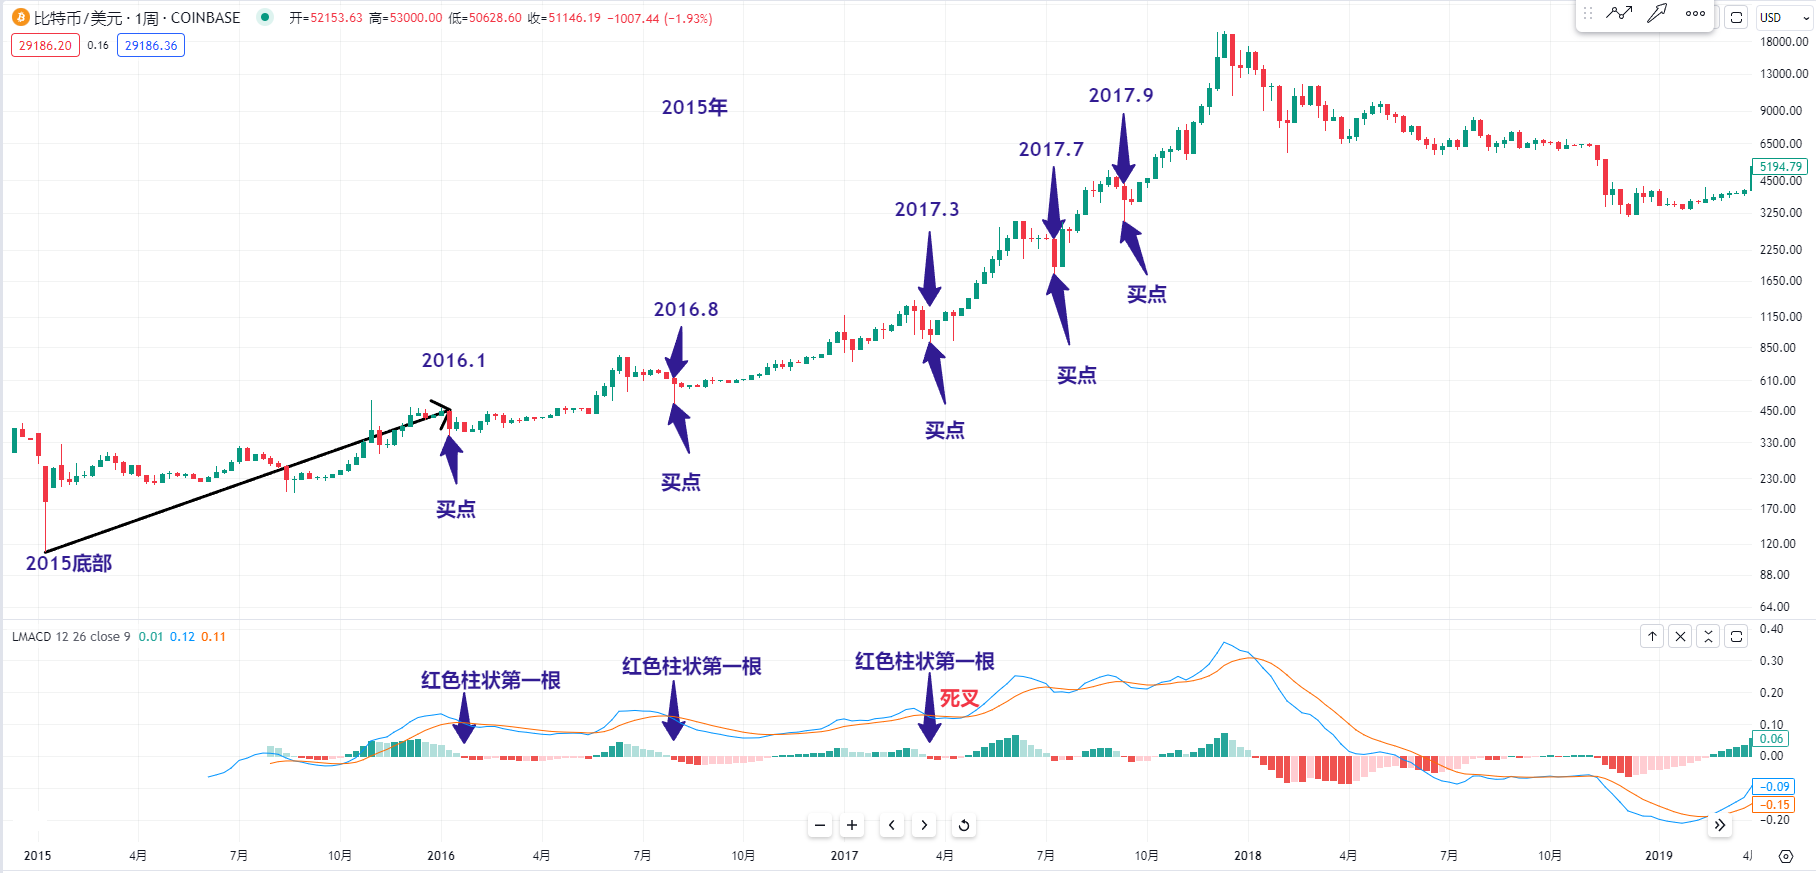
Then let's take a look at the bull market of Bitcoin from 2015 to 2017. I found that the logarithmic MACD indicator basically reached 90% to 100%, and the buying points were very accurate. We can observe Bitcoin from the bottom in 2015 to around January 2016. After the low point in January 2016, the price did not fall afterwards.
And the logarithmic MACD indicator below showed a death cross, and the first red bar came out. This low point did not fall afterwards, so going long at this position with a 100x position will also bring significant profits in the future. Then let's take a look at August 2016, it's the same. The first red bar of the logarithmic MACD indicator below is at the low point of the downtrend candlestick. Positions like this are also very important for going long and holding for future profits.
Then let's take a look at around March 2017 when Bitcoin rose to around March 2017. We can see that the low point of this candlestick did not fall afterwards, and the first red bar of the logarithmic MACD indicator below is at the death cross position. Going long at this position will also bring profits to the top. Including the important buying points in July 2017 and September 2017.
So, yesterday I found this logarithmic MACD indicator, or at the recent position of Bitcoin, including the previous position, we can observe that from 49,000 to the low of about 39,000, we can see that there was no red bar of the logarithmic MACD indicator at that low point.
However, a red bar appeared at the second position, and the price of Bitcoin also rose afterwards. So, if you want to continue going long at the current position, we still need to observe whether Bitcoin is continuing to consolidate at this position, or if there will be a downtrend later. As long as the logarithmic MACD indicator has a death cross below, and if you see the first red bar, it is a buying point to continue going long.
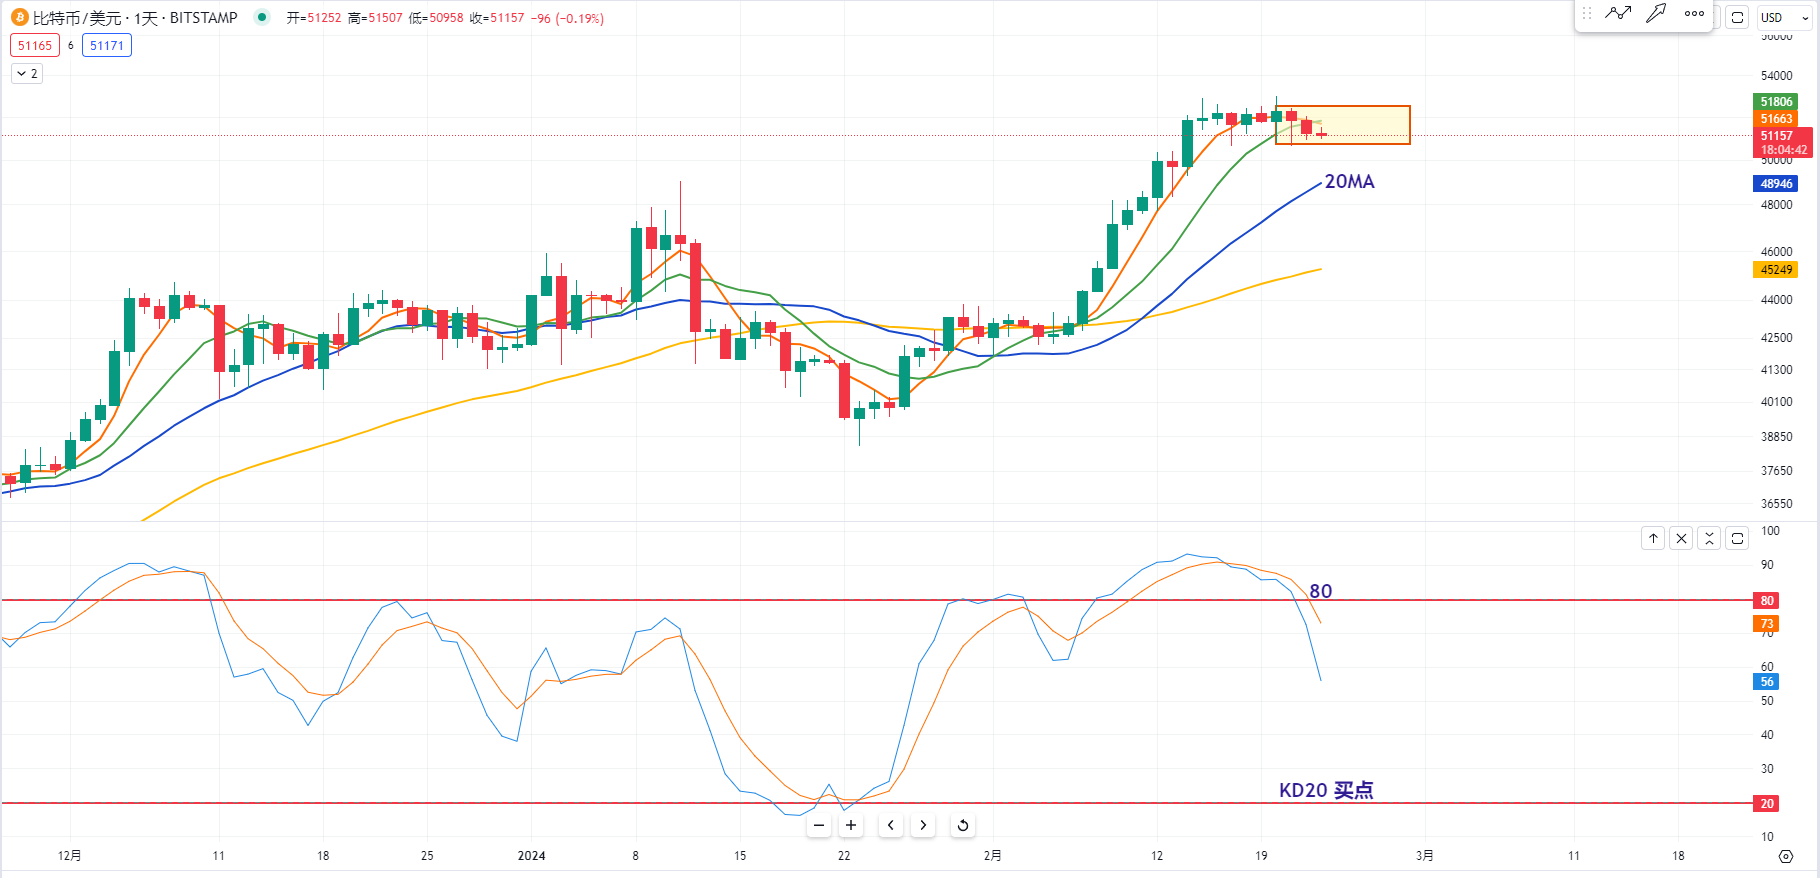
Then let's take a look at the daily chart of Bitcoin. Yesterday, Bitcoin also had a downtrend candlestick. The downside is that the price has been fluctuating around the positions of the two previous lower shadows, and in the short term, we can observe that the 5-day and 10-day moving averages are currently crossing downwards at this position.
So, will it continue to decline in the short term? I think in the short term, the 20-day moving average is still supporting below. So, we need to observe whether this consolidation will continue to be supported by the 20-day moving average. If it doesn't, then we need to observe whether the KD indicator below may come to around 20, which is also a very important buying point.
For more strategies, you can join the live trading.
Candlesticks are king, trends are emperor. I am Master Chen, focusing on BTC and ETH spot contracts for many years. There is no 100% method, only 100% following the trend. Daily macro analysis articles are updated on the entire network, and technical analysis review videos.  Friendly reminder: This article is only written by Master Chen on the official account (as shown in the picture above). The advertisements at the end of the article and in the comments section are not related to the author. Please be cautious in distinguishing between true and false. Thank you for reading.
免责声明:本文章仅代表作者个人观点,不代表本平台的立场和观点。本文章仅供信息分享,不构成对任何人的任何投资建议。用户与作者之间的任何争议,与本平台无关。如网页中刊载的文章或图片涉及侵权,请提供相关的权利证明和身份证明发送邮件到support@aicoin.com,本平台相关工作人员将会进行核查。


