Before we get into today's article topic, let's take a look at two data charts:
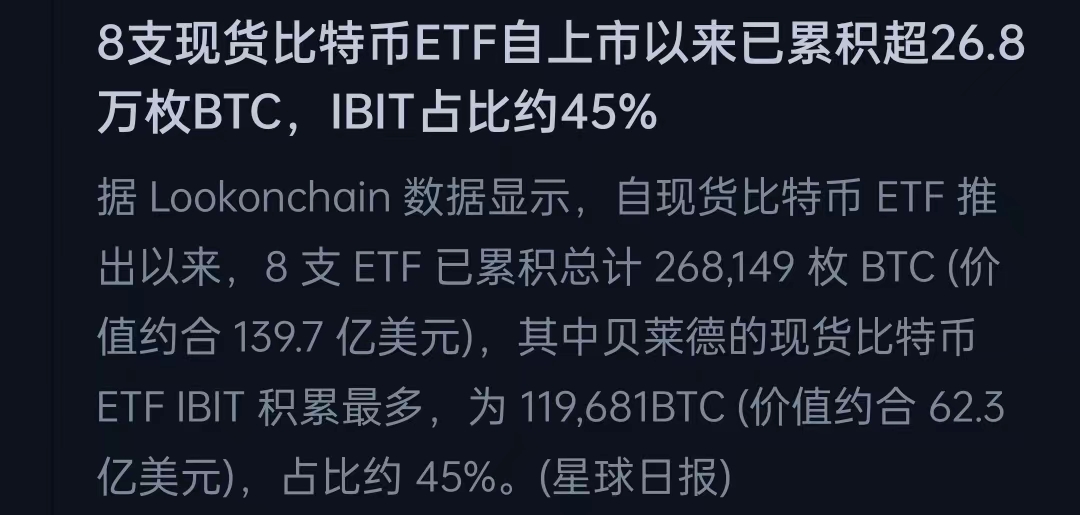
The first chart shows that the 8 Bitcoin spot ETFs have purchased over 280,000 bitcoins since their listing, worth approximately 139.7 billion yuan.
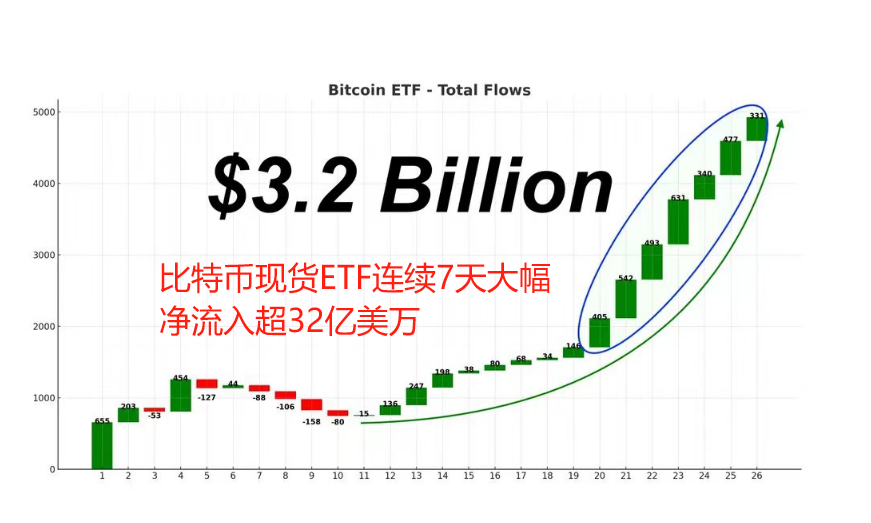
The second chart shows that the net inflow of funds into the Bitcoin spot ETF has exceeded 3.2 billion yuan for several consecutive days (excluding the outflow of grayscale shares).
From the above two charts, we can see why Bitcoin has been so strong recently. The initial buying funds of the ETF are large enough, as the popular saying goes: "There is so much money that it can't be spent, it can't be spent, it simply can't be spent!"
The strong performance of Bitcoin can also be seen from the 30-minute chart, which shows a strong trend with continuous "third buying" signals:
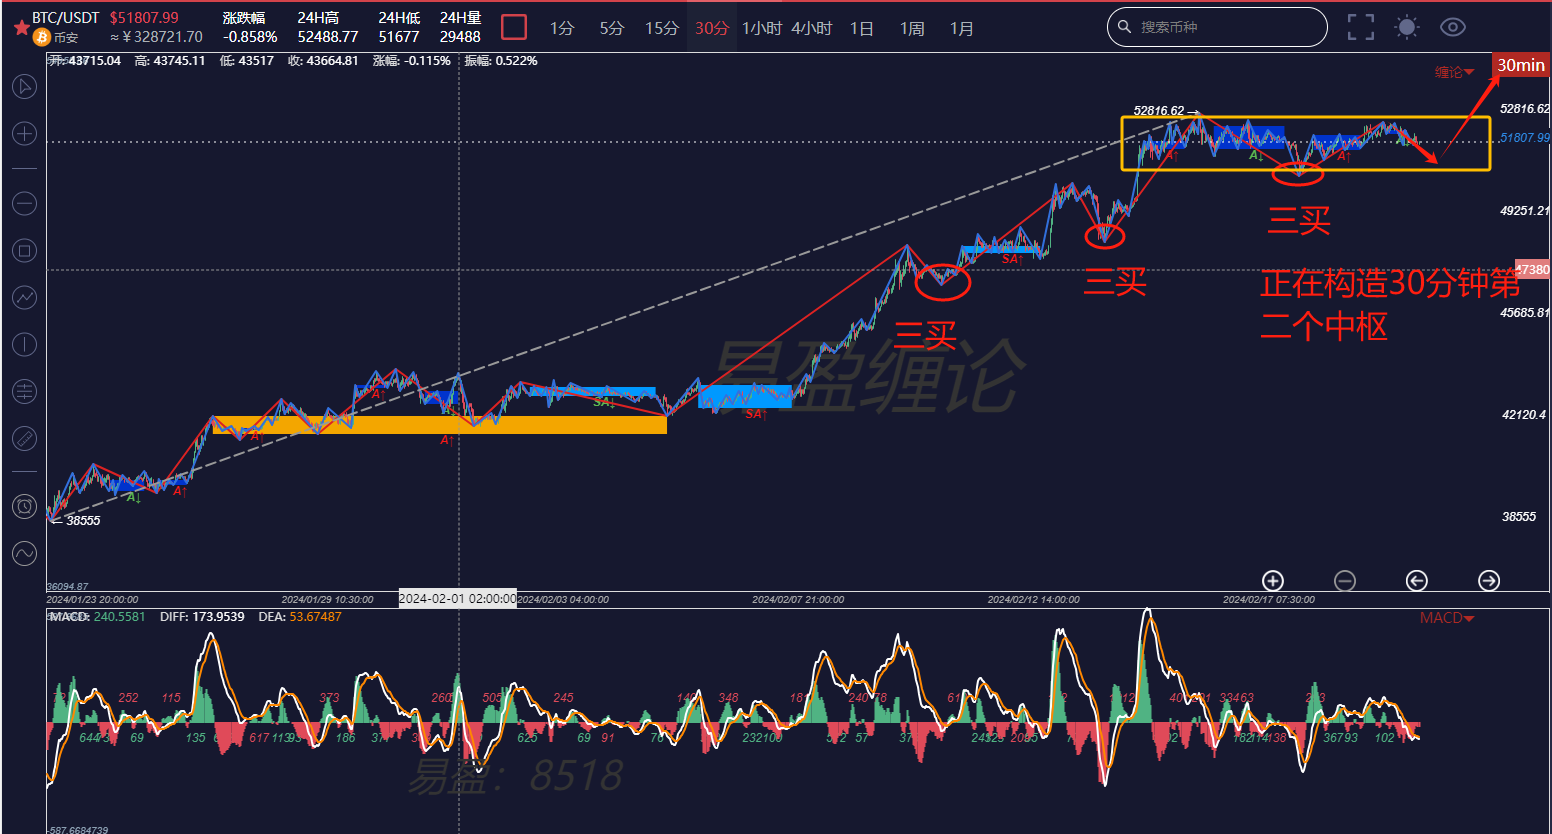
The simpler the trend, the stronger the force, which perfectly combines with the two charts above. At the current trend, the bulls have temporarily paused to shake off the news, which means they are currently constructing the second center of the upward trend on the 30-minute chart.
Bitcoin's strong performance has also driven a significant increase in the entire cryptocurrency market. Ethereum (ETH) has continuously broken through new highs, approaching nearly 3000 points! This account had previously analyzed the trend of ETH on January 11th, mentioning two pressure points to watch for on the daily chart:
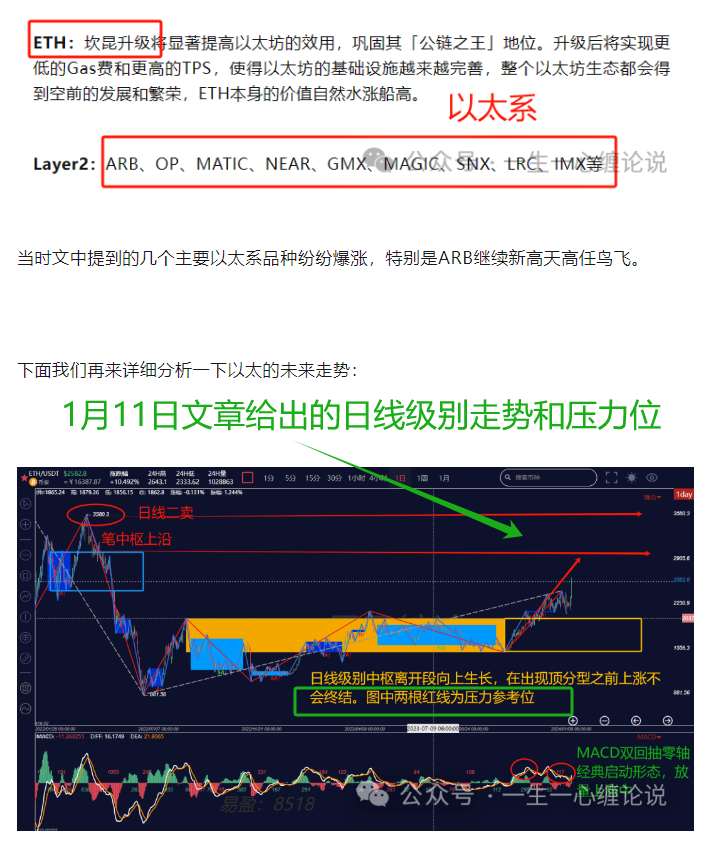
We all know that Ethereum will undergo the "London" upgrade in March and the review of the Ethereum spot ETF in May. With the double positive news, ETH will undoubtedly become the focus of capital speculation. If you have bought at a low position, you can confidently hold on to your chips, but if your position is not enough, it is not advisable to chase after a short-term high. You need to wait for a pullback before replenishing.
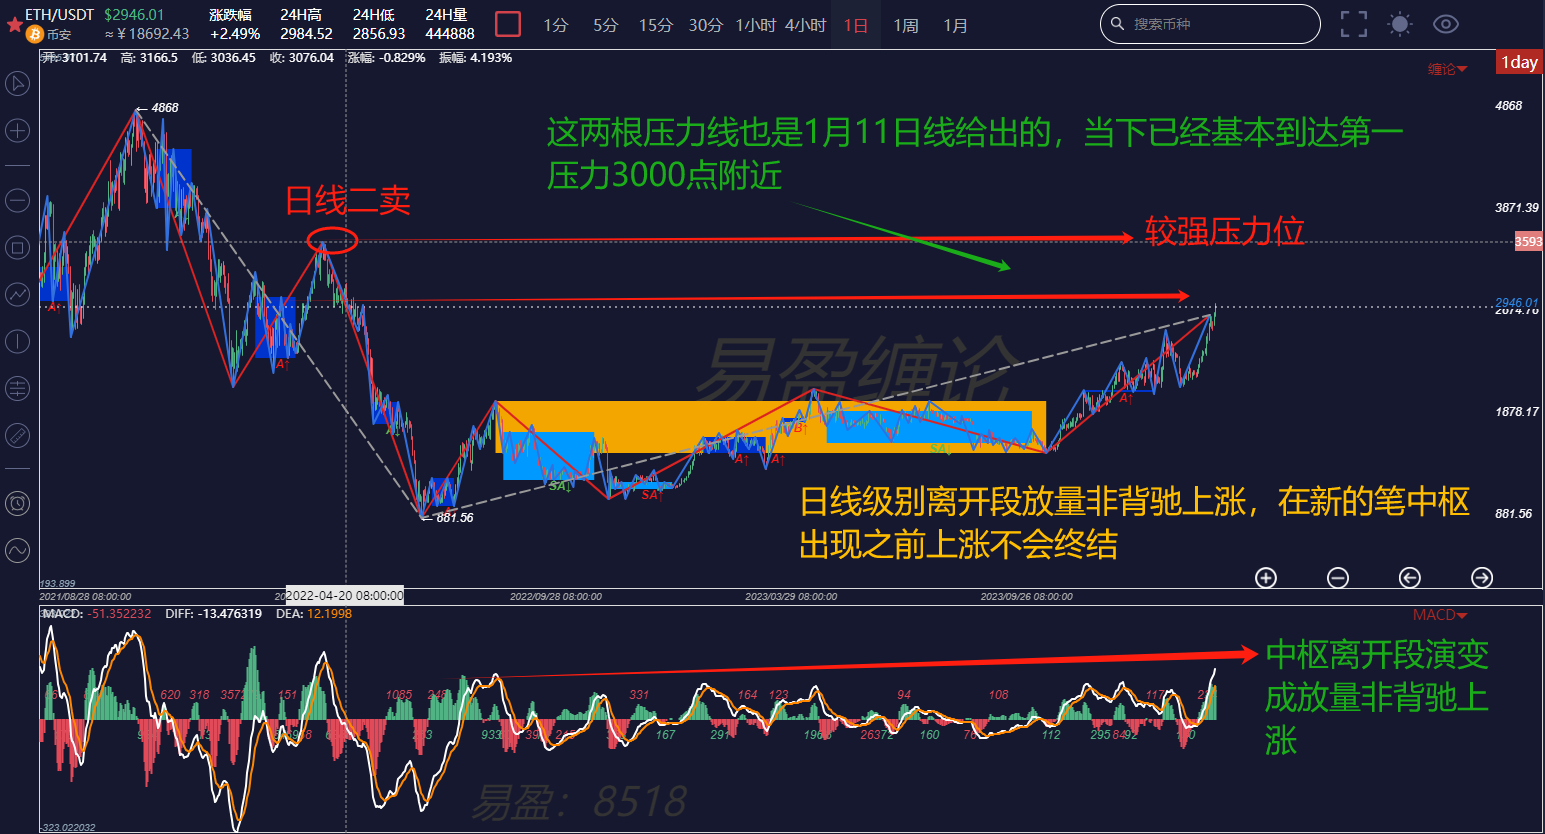
First, let's look at the daily chart. The actual chart is consistent with the trend analysis made in January. It is still running upwards and leaving the daily center, and the departure has evolved from the previous divergence to a volume-driven non-divergent rise. The price is approaching the 3000-point pressure, and it is highly likely to undergo a period of consolidation and then break through.
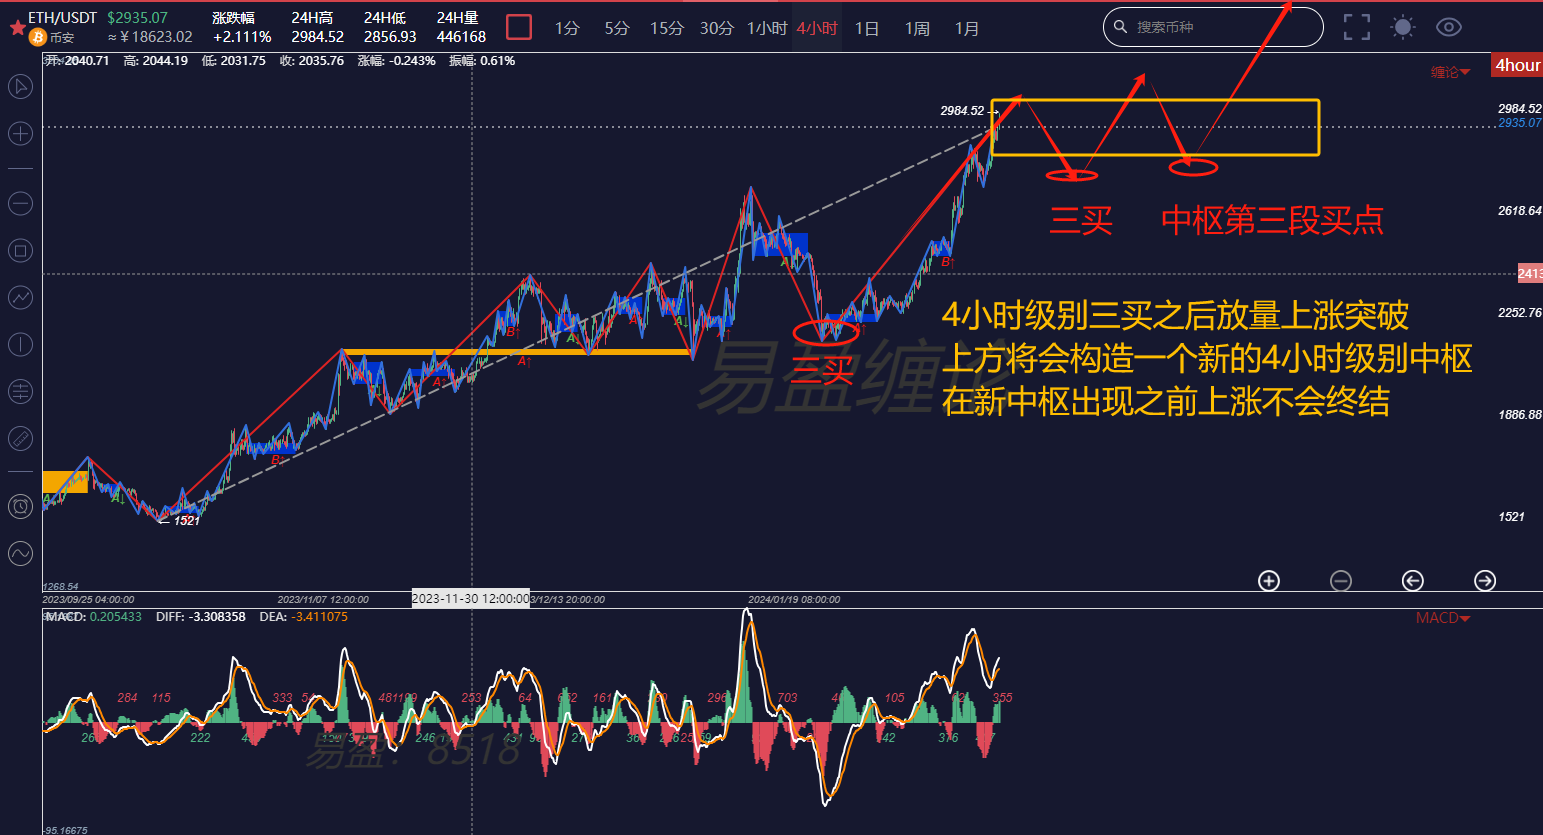
Now, let's look at the 4-hour chart. The strong trend after the "third buying" with increased volume is very strong. However, the price has moved far away from the center, so in the medium to short term, you need to patiently wait for a pullback on the 4-hour chart after the "third buying" before adding to your position. From the structural chart, we can draw a conclusion: the rise will not end until a new 4-hour center appears. In other words, you can continue to hold until a new 4-hour center appears, and then add to your position when a buying point appears on the secondary 30-minute trend type.
If you are interested in the "Chen's Theory" and want to get free learning materials, watch public live broadcasts, participate in offline training camps, and improve your trading skills with the "Chen's Theory" to build your own trading system to achieve a stable profit goal, you can scan the code to follow the public account and add the account's WeChat to join the study group!

免责声明:本文章仅代表作者个人观点,不代表本平台的立场和观点。本文章仅供信息分享,不构成对任何人的任何投资建议。用户与作者之间的任何争议,与本平台无关。如网页中刊载的文章或图片涉及侵权,请提供相关的权利证明和身份证明发送邮件到support@aicoin.com,本平台相关工作人员将会进行核查。


