I, a commoner, have been working in Nanyang, striving to survive in the chaotic market, not seeking fame in the coin circle, but seeking to be true to my heart. I really like a quote from Robert T. Kiyosaki, "The love of money is the root of all evil, and poverty is the root of all evil." I believe everyone in the coin circle is here to profit. I hope that my market analysis in the coming days can help everyone gain a lot in the coin circle. The sea of learning is boundless, and learning is endless. Continuously increasing one's knowledge and combining it with one's own trading habits is the only way to survive and achieve one's ambitions in the coin circle.
First, let's analyze the recent market trends of Bitcoin, Ethereum, Audi, and BGB.
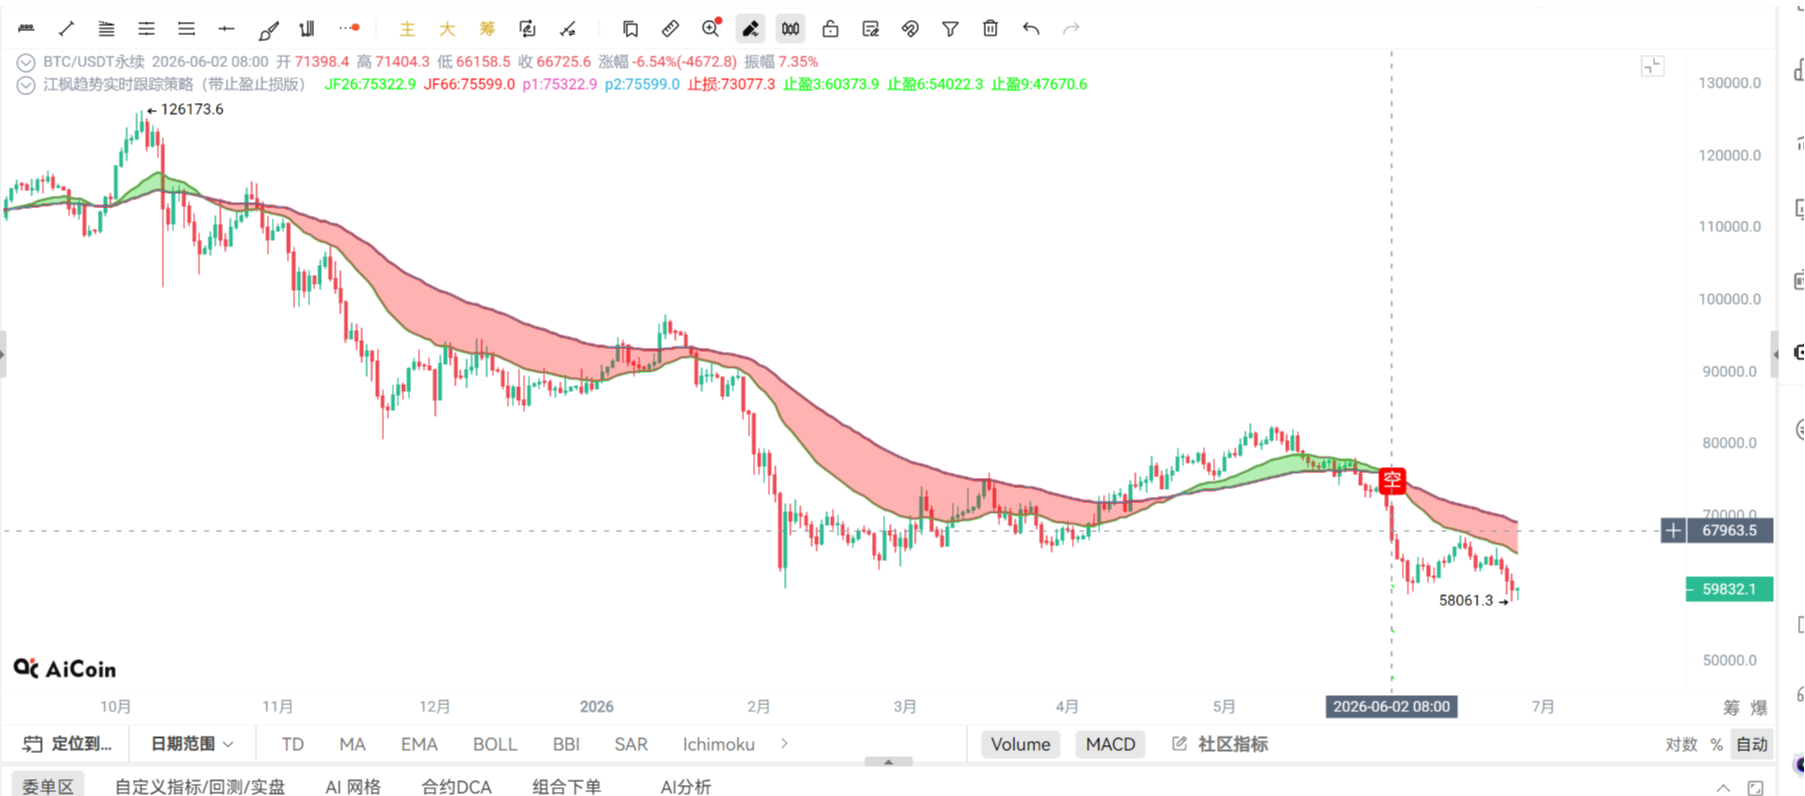
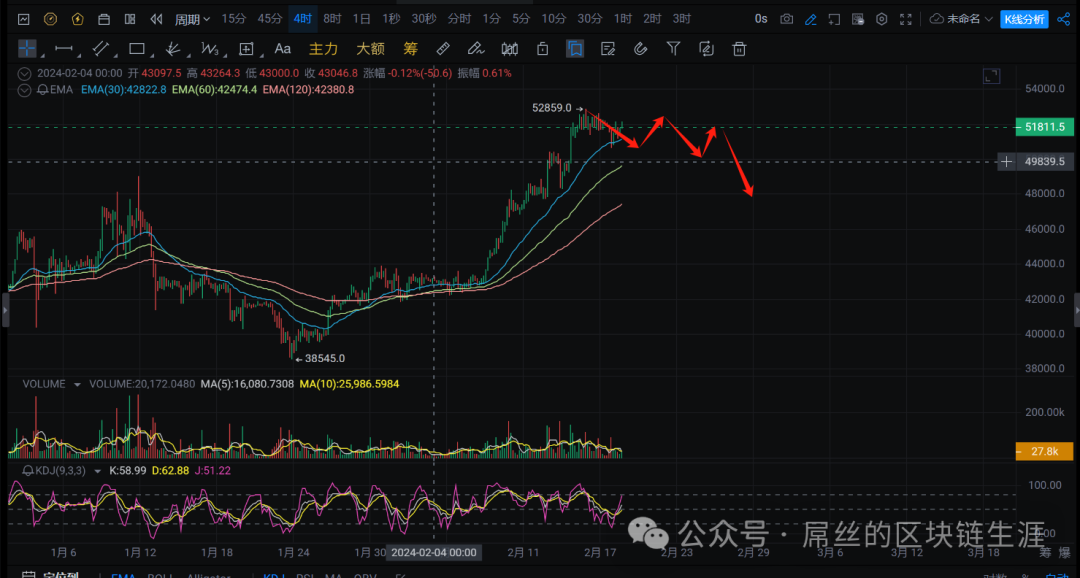
Life's cycle begins anew, cherish the first month of the year. If you want to leave a mark, start a new chapter in the diary every year. This Spring Festival, BTC ushered in an unexpected bull market. Whether looking at the daily or weekly chart, the bullish direction is confirmed. Therefore, taking long positions at lower levels is cost-effective. I haven't given many signals in the core group recently. I shorted once at 45,000, with a small loss, and still have positions open. BTC rose from 38,500 to around 52,880, with an increase of about 36%. This increase is quite significant, mainly due to the recovery of the previous 10,000-point decline, representing a true bullish trend. However, from the market signs, there are two factors indicating that further rise from this level is unhealthy and may lead to a possible pullback on the four-hour and daily chart levels. First, looking at the daily and four-hour charts, the KDJ combined with BOLL bands shows a bearish divergence, which has occurred twice and has become dull, indicating a very dangerous signal. Second, the price has significantly deviated from the moving average, and in this situation, there has been no significant volume on the daily chart, meaning that this rise is not stable, and the possibility of a pullback to the moving average will increase. First, looking at the four-hour chart, there may be high-level oscillation consolidation in the future, using consolidation to repair indicators and moving averages, or a deep pullback to touch the MA120 moving average around 47,300-47,500. We know that pulling back to the MA120 moving average on the four-hour chart is actually the MA30 moving average on the daily chart. Whether Bitcoin is strong or not depends on whether the daily MA30 can hold. If the price continues to stay above the MA30 line, it means the bull market will continue to spread. If it breaks and does not recover, it will definitely touch the daily MA120, which is a guaranteed rebound position, but the price may not reach that level. Therefore, there are many ways to choose the trading strategy. Currently, the market has reached a point where it's difficult to rise further, and a pullback is needed to reach higher levels. Using consolidation or a pullback is the most appropriate. Therefore, my suggestion is: if you are worried that the price will continue to rise from this level, wait until it falls below 51,100 before shorting. If it continues to rise and approaches 53,000 without significant volume, you can also add a short position, with a stop loss at 53,500. When the market falls, two scenarios will occur: first, there will be a significant rebound around 47,500, and second, the profit-taking position near 43,000 on the daily chart. It is not recommended to chase the rise in the near future, as the risk is high and should be treated with caution. If trading in the ultra-short term, quick in and out is necessary.
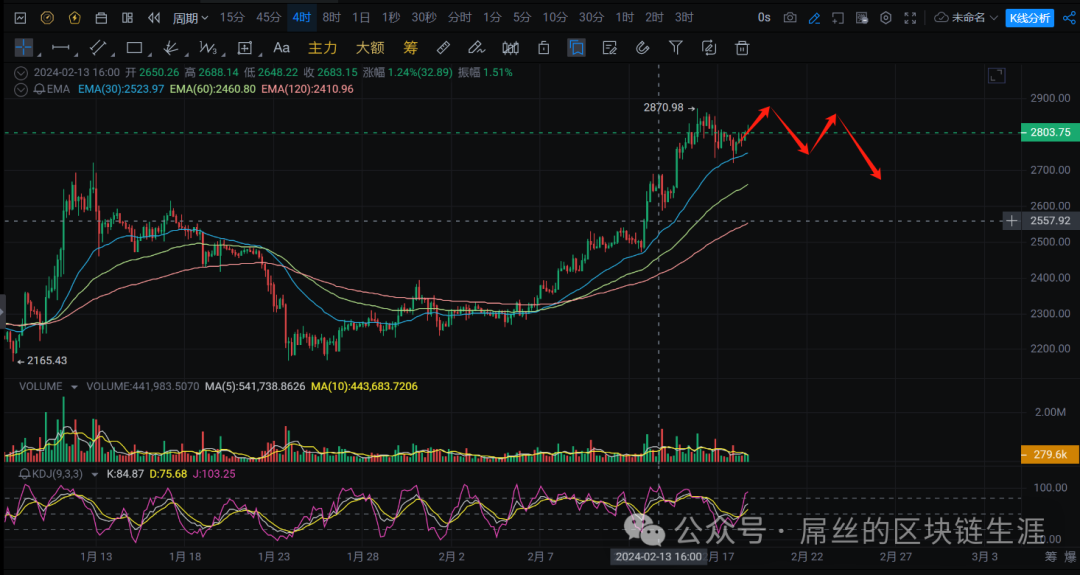
Ethereum, Ethereum rose from 2,150 to a high of 2,868, currently trading around 2,800. Looking at the daily and four-hour charts, it also shows a bullish trend. However, I do not recommend shorting this coin. It's more suitable to go long at lower levels. On the hourly chart, it immediately rebounds upon touching the MA120 moving average, showing a relatively strong performance. There will be a certain degree of pullback in the market, but it's advisable to go long around 2,500. If someone can't resist shorting this coin, they must wait for it to fall below the hourly MA120 moving average and effectively break through before attempting to short, at around 2,750. Overall, Ethereum may continue to reach new highs, so my suggestion is: try not to short, focus on going long, and consider buying at around 2,500. Short positions can be considered when it falls below 2,750.
Audi, Audi's overall pattern belongs to a large-scale wave downtrend. I have predicted this coin many times before and mentioned it during live broadcasts. It will definitely continue to fall, and the concentration of selling points is between 75-80. The pattern belongs to an oscillating upward trend, but the strength is average. There are a few points to pay attention to: consider shorting if it continues to rise to 73, take a short position at 62, and for spot trading, consider buying some around 50. These are relatively large-scale levels, and there may be changes in the future. My suggestion is: if it continues to rise to 73, consider shorting, take a short position at 62, and for spot trading, consider buying some around 50. These are positions that will definitely rebound, and the amount of profit is up to you to decide.

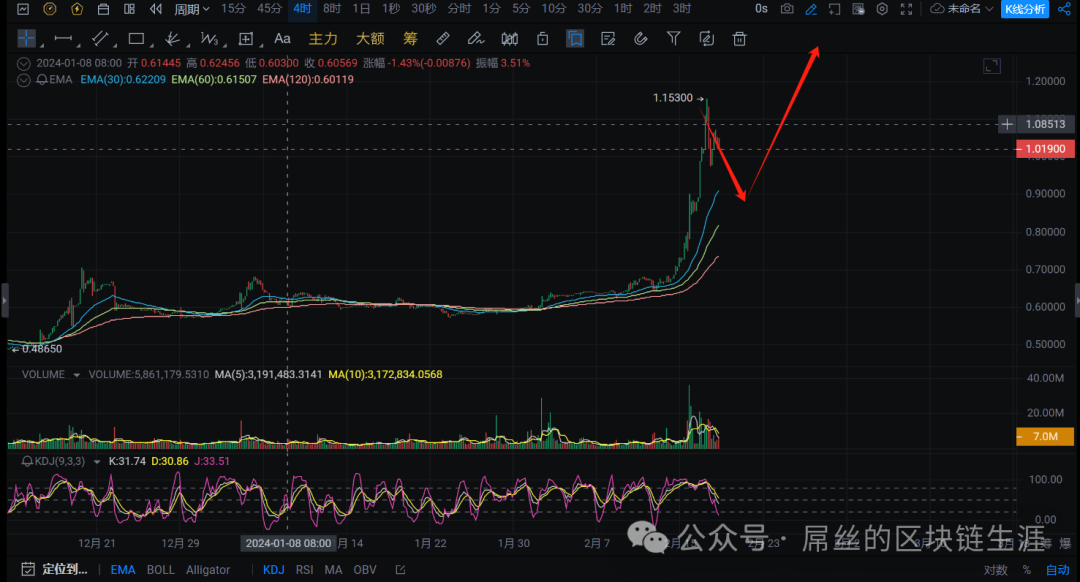
BGB, due to the recent significant increase in the Bitget platform's coin, I actually recommended this coin to a friend of mine in mid-October, and it needs to be held for the long term. The reason is that BGB will follow the historical trends of OKB and BNB, which is beyond doubt. For a platform to develop and become a top three exchange, the market value of its platform coin is crucial. Only when the platform coin rises will the platform continue to improve. Since its launch in July 2021, it has risen 20 times, singing all the way. The pullback during this period will not be too large. I suggest regular investment. The current price is relatively high, so it's best to buy when it falls back to between 0.8-0.9. Hold for the long term. I believe that when the destruction mechanism comes out, combined with a bull market in Bitcoin, this coin will have a very impressive increase.
All the above suggestions are personal opinions and do not constitute investment advice. There are risks in the coin circle, so trading should be approached with caution.
If you need to join the group, you can add the assistant's WeChat.


免责声明:本文章仅代表作者个人观点,不代表本平台的立场和观点。本文章仅供信息分享,不构成对任何人的任何投资建议。用户与作者之间的任何争议,与本平台无关。如网页中刊载的文章或图片涉及侵权,请提供相关的权利证明和身份证明发送邮件到support@aicoin.com,本平台相关工作人员将会进行核查。