
Yesterday we reminded here that the impact of 31800's fall in July and August 23 was similar, and the rebound to MA60 and MA20 was maintained for about a week, similar to the diffusion triangle returning to the platform and then breaking through. So we still need to be cautious.
Today there is an even more dangerous signal:
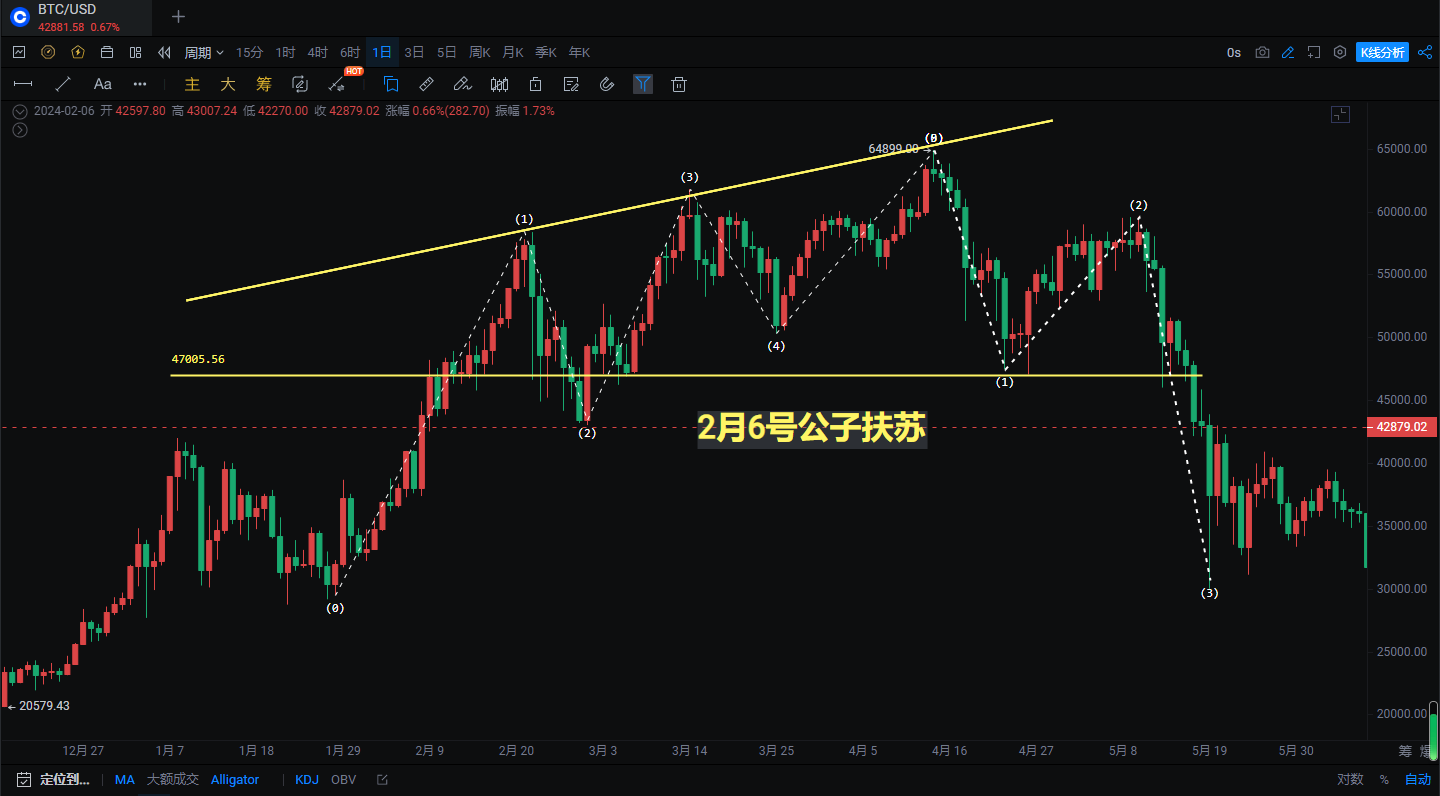
Beware of the possibility of a crash similar to the 519 market
First of all, they have all formed a diffusion triangle (trumpet mouth) in terms of form.
The daily chart rose in 5 waves and then fell in 3 waves, although the 3 waves have not yet appeared in the current market.
In terms of time and space, after breaking through 47,000 before 519, it took 90 days to reach the 3 waves.
It has been maintained for 64 days since breaking through 40,000.
In terms of indicators, the MACD has shown divergence between the fast and slow lines below the zero axis four times before 519, and it continues to move downward.
At present, there is also divergence between the fast and slow lines below the zero axis four times, without breaking through the zero axis.
The moving averages MA20, MA60, and MA120 have all formed similar patterns.
In summary: In our previous long-term layout, we had already exited gradually between 42,000 and 44,000, and we reminded that we would only do short-term trading next and control the position. Breaking through 40,000 also reminded that there would be a rebound to test the small bull market peak, and the overall trend has always been bearish.
Bitcoin
In the short term, the convergence time of the triangle is extended, and there will be a turning point before the 10th. If the 4-hour MACD shows bullish divergence, it remains to be seen whether it can effectively break through 43880. If it can break through, there is still a possibility of touching 45000 or even 47000 again, so there will not be a significant decline in the short term. If 43880 cannot be broken through for a long time, it will accelerate the arrival of a market similar to that of 519.

The second possibility is that it cannot break through 43880 or there is a false breakthrough and then a subsequent decline, so we must be cautious.
Support:
Resistance:

Ethereum
The daily chart is still bearish as it is unable to effectively rise above MA20 and MA60, and there is a high probability of a retracement near MA120. The 4-hour chart has formed an ascending channel, and the probability of breaking through the ascending channel after a fall is high. The upper resistance is still near 2400. The MACD shows bullish divergence, but the strength of the market rebound is not enough.
Support:
Resistance:
ETH/BTC exchange rate has moved horizontally after a decline, and there is a demand for a rebound in the short term, but the entire exchange rate returning to the inside of the daily box can still only be considered as box oscillation, high selling, and low buying.
If you like my views, please like, comment, and share. Let's go through the bull and bear markets together!!!
The article is time-sensitive and is for reference only, and is updated in real time.
Focus on candlestick technical research, win-win global investment opportunities. WeChat public account: 交易公子扶苏
免责声明:本文章仅代表作者个人观点,不代表本平台的立场和观点。本文章仅供信息分享,不构成对任何人的任何投资建议。用户与作者之间的任何争议,与本平台无关。如网页中刊载的文章或图片涉及侵权,请提供相关的权利证明和身份证明发送邮件到support@aicoin.com,本平台相关工作人员将会进行核查。


