1/30/Community: ETH Daily Chart Launches Counterattack; Is it a Bullish Return or a Return to Light?
The live broadcast room shares various mainstream technical indicator application methods, as well as the analysis of the technical form on the day.


[ETH/Daily Chart]
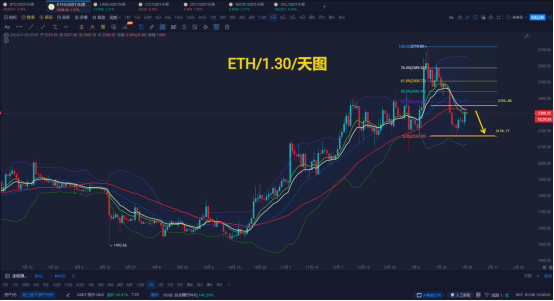
ETH/Daily Chart Technical Trend Analysis: Yesterday, ETH saw a wave of bullish rebound from the intraday low of 2230 to the highest point of 2322, closing at 2326 with a small bullish candlestick pattern on the daily chart. The price rebounded below the 38.2% [2378] of the current bearish trend, while the three moving averages 50MA-15EMA-10EMA temporarily suppressed. It is crucial to see whether the bearish trend ends and the bullish counterattack begins, or if there will be a return to weakness today. If the bulls can continue to break through 2380-2400, then the outlook will target the previous high. Conversely, if there is effective weakening under pressure, the bears will first look at the recent low of 2160 combined with the moving average suppression and Fibonacci 38.2% resistance, indicating a higher probability of weakening.
[ETH/4H Chart]
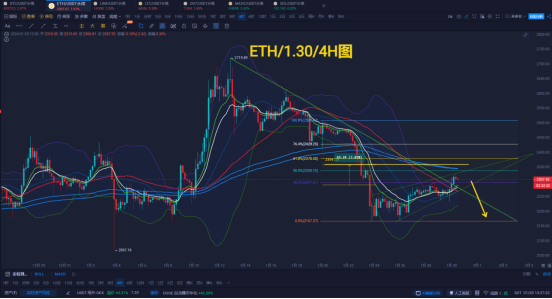
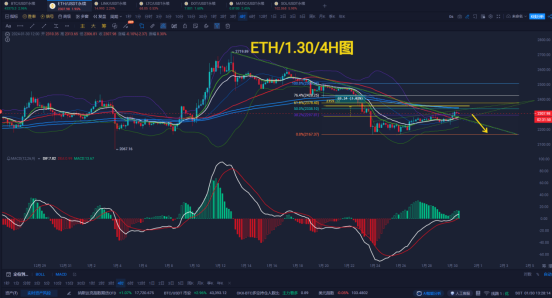
ETH/4H-1H Technical Trend Analysis: Since the downtrend of 2160, it has taken a week to produce two waves of bullish rebound. The pattern is a medium-term continuous wedge structure. The price rebound is currently under pressure from the Vegas Tunnel, and the upper Bollinger Band is also exerting pressure. Looking at the MACD momentum column, there are signs of a top divergence. Confirmation of the end of the rebound and a continuation of weakness will require a strong bearish candlestick on the 4-hour chart below 2250. Currently, attention can be paid to short entry opportunities, with a defensive target of 2360 and a further target of 2160-2100.
For more details, feel free to join the live broadcast room for discussion and learning!

Recommended Approach [Bearish Trend]
Support 2170-2100 / Resistance 2340-2360
Tencent Meeting ID: 565-877-8060
Seven live broadcasts daily: 14:00-21:30 uninterrupted

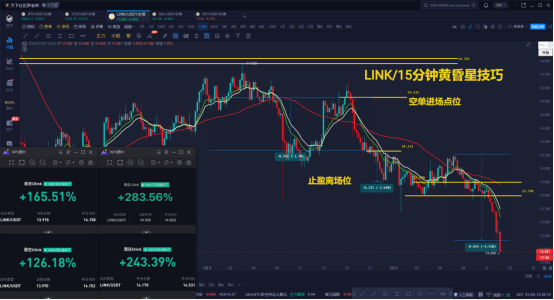
[Liejinshe] What can you get from the Elite Class?
- Get midday videos at the first time // 2. Get market intraday views at the first time
- Get short, medium, and long-term strategies at the first time // 4. Track and guide strategies throughout
- Have the opportunity to participate in exclusive midnight battles // 6. Have the opportunity to participate in million-level courses
[Efficient. Accurate. Capturing Breakthrough Trading Opportunities]
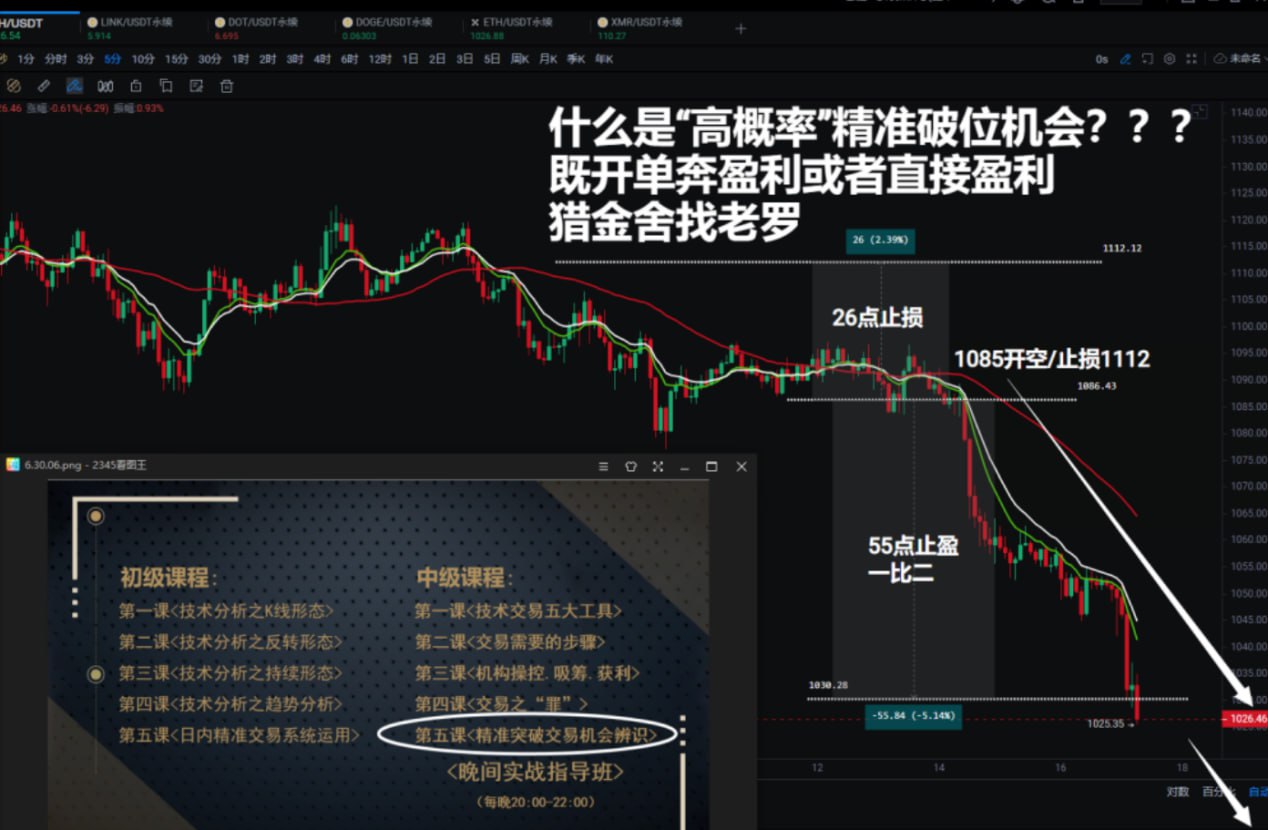

2022 Annual Strategy Guidance Record
2022 February-December /// 10 wins 1 loss
February complete / yield 2500% /// March complete / yield 2500% April complete / yield 2626% /// May complete / yield 3698% June complete / yield 3081% /// July complete / yield 7033% August complete / yield 4694% /// September complete / yield 5046% October complete / yield 1438% /// November complete / yield 2362% December complete / yield -474% ///
2022 February-December complete total 34504%
Single margin 100U calculation * 34504% = 34504U
Each strategy // has evidence, traceable to the start time to the year, month, day, hour, minute, second, and preserved in text and images. Interested parties can scan the code to join the group for certification!!


(Scan the code to follow the official account and experience more services)
免责声明:本文章仅代表作者个人观点,不代表本平台的立场和观点。本文章仅供信息分享,不构成对任何人的任何投资建议。用户与作者之间的任何争议,与本平台无关。如网页中刊载的文章或图片涉及侵权,请提供相关的权利证明和身份证明发送邮件到support@aicoin.com,本平台相关工作人员将会进行核查。


